A Boolean simulation is a simplified approach to study the behavior of signaling
pathways or gene regulatory networks, when limited or no quantitative data is available.
It is also appropriate for managing complex systems, for which quantitative simulation
might be very costly. Each entity in the system has a Boolean state: either True (active)
or False (inactive). Boolean formulas encode the relationships between entities,
represented by a Boolean Network. In synchronous Boolean networks, at each step of the
simulation the Boolean formulas and the current state of each entity determine its next
state.
Example Boolean Network
For a system where Y activates X, X AND Z together activate Y, and Z is active in the
absence of X, this is encoded by the Boolean formulas:
The following Boolean network represents this system.
Example Boolean Network
When the system evolves during a simulation, the state of each entity changes
according to its Boolean formula. This table provides a description of each possible
state of the system and its next state in a Boolean simulation.
Table 1. Transitions in a Boolean Simulation
t
t + 1
X
Y
Z
X
Y
Z
0
0
0
0
0
1
0
0
1
0
0
1
0
1
0
1
0
1
0
1
1
1
0
1
1
0
0
0
0
0
1
0
1
0
1
0
1
1
0
1
0
0
1
1
1
1
1
0
For this example network, the following table describes the states of each
entity (assuming that each entity in the network is initially on).
Table 2. Entity States
0
1
2
3
4
X
1
1
1
0
0
Y
1
1
0
0
0
Z
1
0
0
1
1
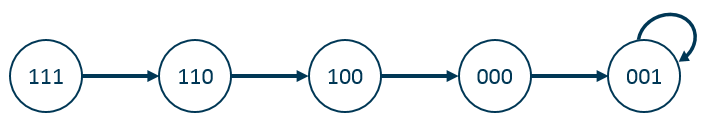
This table provides the system orbit (its state
during the evolution of the simulation). The following State Transition
Graph summarizes the table, the label for each node represents the state
values of the entities X, Y, and Z. The loop on the last state 001 indicates that the
system has reached an attractor from which there is no further evolution. In this case,
the attractor corresponds to the identical steps 3 and 4 in the table.
State Transition Graph. The indexes ordered XYZ.
Final State
A Boolean network has a finite number of states (2N for N entities), so it
always reaches an attractor, in compliance with Dirichlet's box principle. An attractor is
a group of states that repeat when applying the transition rules. This attractor can be a
single steady state (a fixed point like the state 001 in the example above) or a cycle of
two or more states that oscillate. For a cyclic attractor, the final state for each entity
is computed as an average of this entity along the cycle duration. For a single steady
state, the final state is the last computed state of an entity during a Boolean
simulation. The aggregated heat map assembles the final states of the observed entities
for each perturbation.
Results
The results consist of a collection of entity states computed during a simulation.
Individual results consist of a sequence of states for each entity in a single
perturbation. Aggregated results compile the final states of observed entities for all
perturbations in a heat map.