About Band Analysis | ||||||
|
| |||||
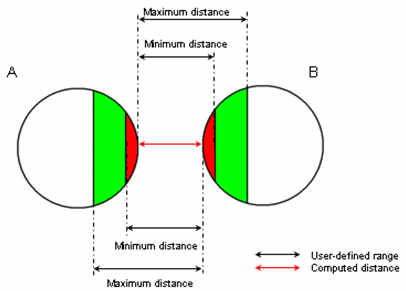
In the figure below, the green area on A corresponds to all the points on A for which the minimum distance to B is within the user-defined minimum and maximum distance. The red area on A corresponds to all the points on A for which the minimum distance to B is less than the user-defined minimum distance.

Band analysis takes into account the accuracy you define. The green area corresponds to the maximum distance +/- the accuracy, and the red area corresponds to the minimum distance +/- the accuracy. A lower accuracy value will provide a more accurate result, but the computation time will be higher.
The band analysis result remains visible (in the geometry and in the tree) whilst the product remains open during a given session only. If you edit a band analysis measure which is not displayed in the geometry (for example, after opening the product), then, the result will be computed and displayed.
You cannot save the band analysis result, however you can export it as 3D geometry.