Average Time from Create to Completion | ||
| ||
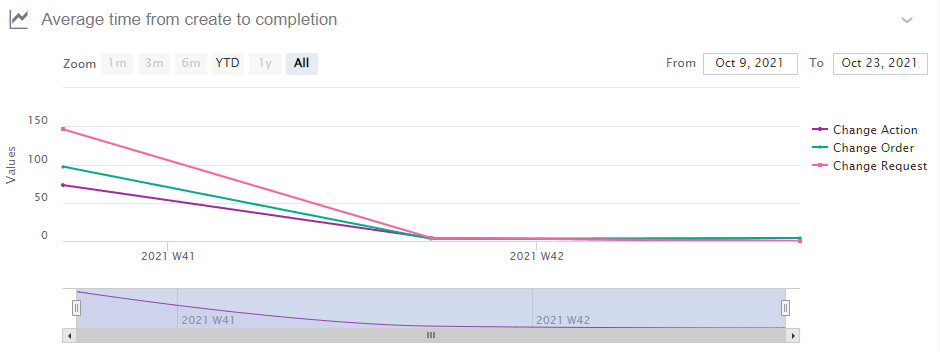
| Business Objects |
|
| Values (or x-axis and y-axis) |
|
| Available Views | Line chart. |
| Interactions | On this chart, you can:
|
| Colors | Colors used in Enovia. |
| Technical Details | — |
 See underlying data
 Maximize