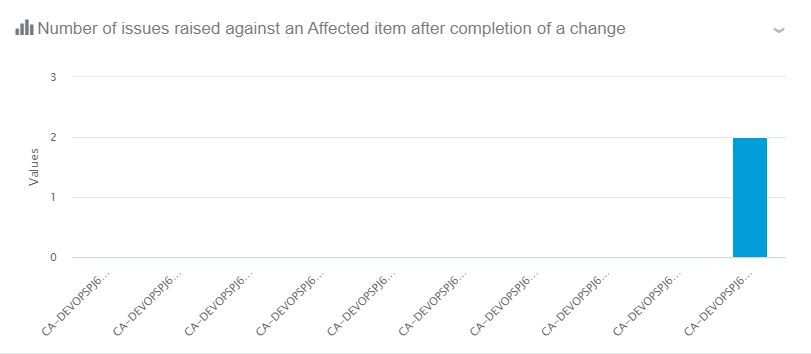
Number of Issues Raised Against an Affected Item After Completion of a Change

This chart shows the number of issues raised for each change action, until the completion date of the change action.

Business Objects Change actions
Values (or x-axis and y-axis)
  • X-axis: Change actions
  • Y-axis: Number of issues
Available Views Bar chart.
Interactions On this chart, you can:
  • Hover over a bubble to see details in a tooltip.
  • Show underlying data by clicking Menu > See underlying data.
  • Increase the chart size by clicking > Maximize.
Technical Details