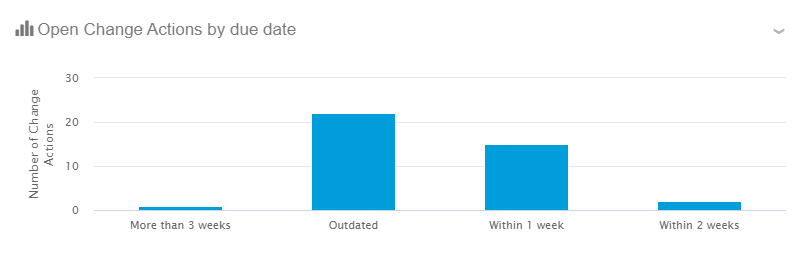
This chart shows the number of change actions with non-closed maturity (all states
except 'Complete' and 'Canceled') per due date (within 1 week, 2 weeks, 3 weeks, more than 3
weeks).
Business Objects
Change actions
Values (or x-axis and y-axis)
X-axis: Due date
Y-axis: Number of change actions
Available Views
Bar chart
Interactions
On this chart, you can:
Show underlying data by clicking >
See underlying data.
 See underlying data
 Maximize
 Colorize 3D