Define the Data to Show
-
In the Properties panel, go to
 Data.
Data.
-
Select a data query and a Result Set.
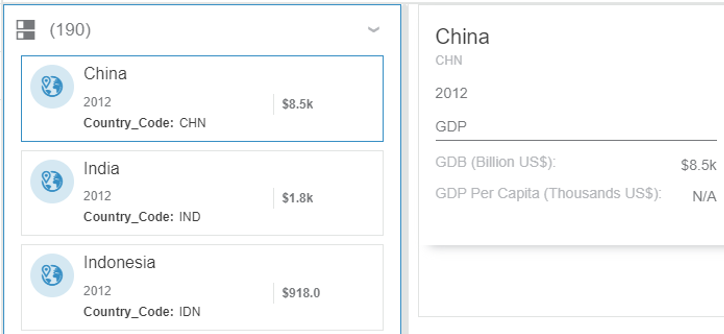
Configure the Hit Selection Variable
-
In the Properties panel, go to
Data.
-
In the Hit selection section:
-
Select a context variable to open and display the detail
column if its not empty, and identify the selected item within the list.
-
Select field to compare with variable that contains the
details to display in the visualization. For example, you could show the details of
a field containing countries.
Format the Display of Hit Elements
You can define the formatting of the fields displayed in title, subtitle, and body
in the hit content.
-
In the Properties panel, go to
Data.
-
In the Data section, choose the hit content element on which
you want to apply some formatting, that is Icon,
Title, Subtitle,
Description, and click More options.
A panel appears on the left with formatting options.
-
From Format, you can select a number format, such as a
currency, a number with digits.
-
You can also define a font weight (bold, italic), a default value, and the tooltip to
display on the UI.
Use Fields as Badges at the Bottom of the Hit
Select the fields to display as badges at the bottom of the hit, below hit
properties.
-
In the Properties panel, go to
Data.
-
From Badges, click
 . .
- Optional:
Select the icon representing the type of badge. It displays on the left of the badge
title.
-
Select the field to display as a badge at the bottom of the hit.
- Optional:
Add more badges.
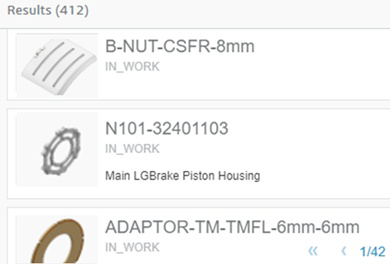
Show Images in Hit Results
You can configure the display of specific pictures for each hit, to have a preview of the selected object. It can be a 2D image of a part, an equipment picture, etc.
-
In the Properties panel, go to
Data.
-
In the Data section, select Show
image.
-
From Field to use as image URL, select the field, which
contains a URL pointing to an external picture for each hit.
Note:
You can use images ingested through Data Factory Studio and stored on the DFS Object Storage service of the 3DEXPERIENCE platform. In that case, you must:
- Configure a Semantic Graph Index
unit storage datamodel class, with a property containing
the image file id that is pushed in the object storage.
- Configure an Index Tabular Data pipeline to ingest the
file id from a source file (CSV, JSON, or Parquet).
Split the Hit Details in Sections
Use sections to split the Hit Details visualization into several sections, each
displaying one or more fields.
-
In the Properties panel, go to
Data.
-
From Sections, click .
- Optional:
Select the Maximum width and Minimum
width of the hit section.
-
In Section name, enter the name of the Hit Details
section.
- Optional:
From Fields, select the fields to show in the Hit Details
section. For each field, define a label.
|