Define the Data to Show
-
In the Properties panel, go to
 Data.
Data.
-
Select a data query and a Result Set.
Define the Chart Title and Icon
-
In the Properties panel, go to
 Style.
-
Specify the chart title.
Note:
To localize this title in other languages, click  , and
select a translation key. You define keys and translation values in the
Translation menu. , and
select a translation key. You define keys and translation values in the
Translation menu.
-
Select the icon that represents your chart.
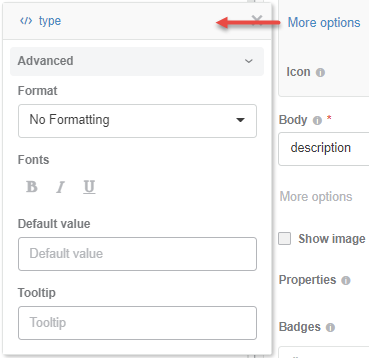
Format the Display of Hit Elements
You can define the formatting of the fields displayed in title, subtitle, and body
in the hit content.
-
In the Properties panel, go to
Data.
-
In the Hit Content section, choose the hit content element on
which you want to apply some formatting, that is Title,
Subtitle, or Body, and click
 . .
A panel appears on the left.
-
From Format, you can select a number format, such as a
currency, a number with digits.
-
You can also define a font weight (bold, italic), a default value, and the tooltip to
display on the UI.
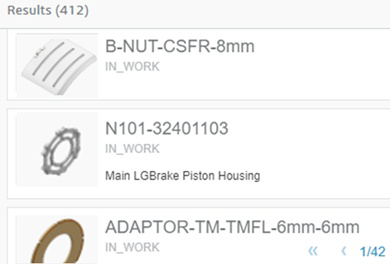
Show Images in Hit Results
You can configure the display of specific pictures for each hit, to have a preview of the selected object. It can be a 2D image of a part, an equipment picture, etc.
-
In the Properties panel, go to
Data.
-
In the Hit Content section, select Show
image.
-
From Field to use as image URL, select the field, which
contains a URL pointing to an external picture for each hit.
Note:
You can use images ingested through Data Factory Studio and stored on the DFS Object Storage service of the 3DEXPERIENCE platform. In that case, you must:
- Configure a Semantic Graph Index
unit storage data model class, with a property containing
the image file id that is pushed in the object storage.
- Configure an Index Tabular Data pipeline to ingest the
file id from a source file (CSV, JSON, or Parquet).
Configure Sorting
You can specify the fields available in the Result List to filter the results.
-
In the Properties panel, go to
Data.
-
In the Sort and Limits section, select Include
Sort.
-
For Default Sort, select the field on which results are sorted
by default.
- Optional:
Configure more Sort Fields.
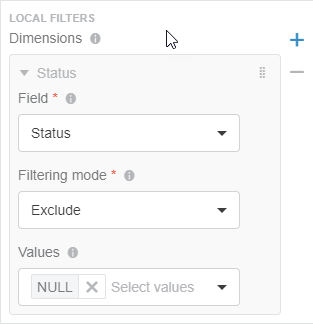
Reduce the Scope of Dimensions with Local Filters
For a visualization that displays data for a dimension (for example, in a chart axis), it may be useful to focus on specific values for that dimension. You can do so using a local (internal) filter.
For example, if you have a priority dimension that contains Very
Minor, Minor,
Major, and
Critical priorities, you may want
to display values for the Major
and Critical priorities only.
-
In the Properties panel, go to
Data.
-
In the Local Filters section, specify the
dimensions for which you want to filter data out as follows:
-
From Field, select the dimension on
which you want to apply the filtering.
-
From Filtering mode, select
Include or
Exclude.
-
From Values, select the set of values to
include or exclude from the dimension.
For example, for the Status dimension, you can
exclude
NULL values.
Configure On-Click Effects for Results
You can specify several types of interactions for your visualization hits. For
example, you can configure an on-click effect so that clicking a result opens the result
details in the Hit details visualization.
-
In the Properties panel, go to
 Action.
-
In the Effects (On click) section, click
 . .
-
Specify the on-click effect by selecting a behavior:
| Option | Description |
|---|
| Set variable |
- In Information Source, select the hit attribute on
which you want to add the on-click effect.
- In Target Studio variable, select the data query
variable to open and display the detail column (if it is not empty) and identify
the selected item within the list.
|
| Filter |
Filters screen data with the content dropped on the screen.
|
| Select 3DPart |
Allows you to set the visualization focus on a part of a product structure.
- Optionally, activate Focus on 3D Part, if you want to
zoom on the part in the product structure.
-
For Information type, select:
-
Reference ID: It is useful to identify one or
several occurrences of a part in the loaded structure. However, you cannot
differentiate specific occurrences of the same part. To use this option,
also select the Reference ID Source.
-
Occurrence Path: It is useful when a part is used
several times in your 3D model, as it allows you to identify the specific
occurrences of the part in the loaded structure. For example, for a car,
you can have 4 wheels, but you want to identify precisely each of the
wheels. To use this option, also select the Occurrence Path
Source.
|
- Optional:
Select Add drag button in the first column to add a drag icon
 in that
column for users to drop objects in another 3DEXPERIENCE platform widget. in that
column for users to drop objects in another 3DEXPERIENCE platform widget.
-
In Information source, select the field to use as data
source.
-
In Object type, specify the name of the object to
drag.
-
For 3DEXPERIENCE Service, select the variable which
contains the id of the 3DEXPERIENCE Service from which the data comes from. For
example, 3DSpace.
Copy Data On-Drag
You can specify objects that Data Viewers can drag to another 3DEXPERIENCE platform widget, to refresh the display of that widget.
- In the Properties panel, go to Action.
- In the Copy data (On drag) section, configure the objects that users can drop in another 3DEXPERIENCE platform widget.
- In Information source, select the field to use as data source.
- In Object type, specify the name of the object to drag.
-
For 3DEXPERIENCE Service, select the
variable that contains the id of the 3DEXPERIENCE Service from
which the data comes. For example, 3DSpace.
|