Tabs

You can use this visualization to organize components by tabs within a page.

You can use this visualization:

  • In master/details views to mimic standard "skeleton" views.
  • Anywhere in a page to partially change the content while keeping other parts fixed. For example, KPIs at the top of the page, and tabs below.

This task shows you how to:

Organize the Layout with a Set of Tabs

  1. Configure the tab Title, Icon, and Layout (vertical or horizontal stacking option).
  2. Add components in the active Tab layout.
  3. Add a new tab and configure the Title, Icon, and Layout.
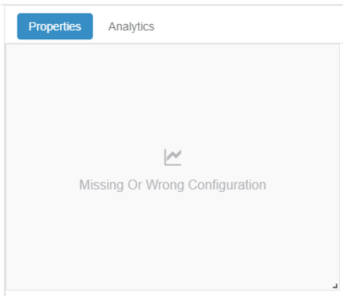
  4. Select the second Tab in the canvas.
    The visualization displays the layout of the second tab (it is empty).
  5. Add components in the active Tab layout.

    Notes: You can:
    • Reorder the list of tabs.
    • Use the style option to switch from standard to "boxed" style.


Add a Condition to Show the Canvas within a Tab

You can add a condition to display or hide the canvas component within the visualization. This allows you to reveal or not information depending on values.

  1. Select a tab, and click to add a Content.
  2. Select Canvas and click the zone below the tab title.


    The Canvas properties open on the right.
  3. In the Display section, click to add a Conditional display.
    1. For Select context variable, select the variable that will store the condition values.
    2. For Comparator, select the condition comparator. For example, select <= if you want the condition to apply only if the field value is lower or equal to the condition value.
    3. For Value, specify the numerical value of the condition. For example, 5.