-
From the Behavior Tools section of the action bar, click Modelica Scripting
 . .
The Modelica Scripting window appears.
-
To create a plot window with a first chart, do, in the command input line in the lower
part of the Modelica Scripting window, the following:
-
To create a plot window with a chart, type
createPlot(id=1,subPlot=1); and press
Enter.
- The "id" value is an identifier for the plot window.
- The "subplot" value is an identifier for the chart.
An plot window with an empty chart is created.
-
To create a curve in the chart, type
plotArray({0,1,2,3},{5,4,6,5}); and press
Enter.
A curve is created in the empty chart.
-
To create a header of the chart, type
plotTitle("My Chart
                1",id=1);
and press Enter.
The chart now also has a header: 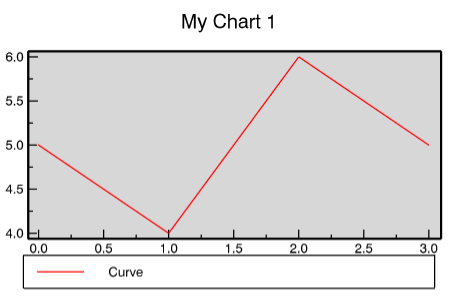
-
To add another chart in this plot, do Step 1 again, but with these lines, one by
one:
createPlot(id=1,subPlot=2);
plotArray({0,1,2,3},{2,10,1,0});
plotTitle("My Chart 2",id=1);
The plot window now has two charts, with headers: 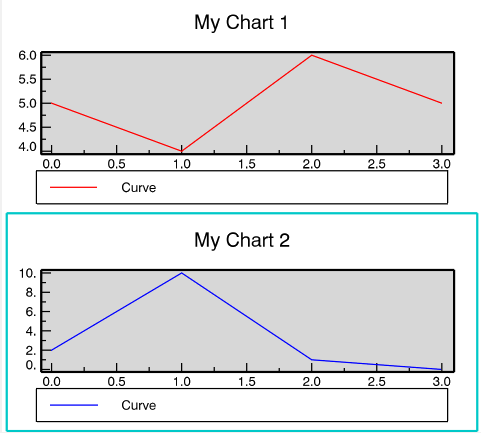 Note:
You may have to enlarge the plot window to see the
headers.
|