-
From the Behavior Tools section of the action bar, click Modelica Scripting
 . .
Note:
Below the Modelica Scripting window is used, the
Modelica Script Editor can also be used. For information about
the scripting alternatives, see Scripting.
The Modelica Scripting window appears.
-
To create a plot window with a chart, type, in the command input line in the lower part
of the Modelica Scripting window, the text
plotScatter({1,3,2,5},{10,11,15,5});, and press
Enter.
A plot window with a scatter plot is created: 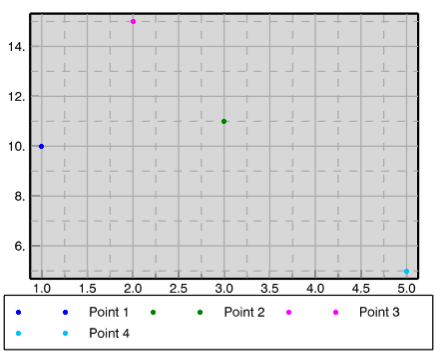 Note:
This example is a simple scatter plot. To see all possible input parameters for
the function plotScatter, you can enter, in the command input line in
the lower part of the Modelica Scripting window, the text
document("plotScatter"), and press
Enter.
|