- From the Analysis & Output section of the action bar, click New Interference
 .
. The Interference Specifications dialog box appears.
- In the Context tab, select Groups against groups.
- Create interference probes to enable clash detection.
- Click OK.
This is added to the current scenario.
-
Right-click Interference.1 for the context menu.
-
Select Add to Current Scenario (Interrupt).
-
Right-click the Facing, and Select Starts Machine Simulation from the context menu.
The simulation happens as per the tool path of the
machining operations. The machine
simulation traces the generated tool path.
Note:
If the Mill-Turn machine is the ASO, then the simulation is launched on
the part operation. If a milling machine or a Turret is the ASO, then the simulation starts
on the corresponding manufacturing program.
- From the Analysis & Output section of the action bar, click Display Fault
List
 .
.
The Fault List dialog box appears and lists in
detail the faults encountered during simulation. Collisions (including material
removal collisions) encountered during simulation appear in red, and tools, tool
shanks, or stock are outlined in the work area.
-
To choose the simulation results to list in the dialog box, click
Part Operation/ Program, Recent
Activity, or Scenario Results in the
Choose Result section.
The results of the simulation type that you chose are listed in the
dialog box.
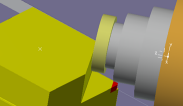
When a line is clicked in the Fault List, the machine is
positioned at the location of the collision. The rough stock is displayed (yellow)
as it was when the collision occurred and the volume in collision is displayed (red)
if the option is active. Continuous collisions are displayed as one line in the
fault list.
The Simulation Log also gives a brief description.

