Collision Fault List | ||
| ||
| Choose Results |
|---|
| Part Operation/ Program |
| Recent Activity |
| Scenario Results |
Simulation Results
You can choose which simulation result to display in the dialog box with the Choose Result options.
- Choose Result
-
- Part Operation/ Program: Results from a part operation or manufacturing program.
- Recent Activity: Results from the latest single or multimanufacturing operation.
- Scenario Results: Results from the latest scenario computation (applicable only with MSR context).
If you start another simulation on a part operation or manufacturing program, then the existing Part Operation/ Program list clears and a new list takes its place. In this case, the Recent Activity list also clears since they are now irrelevant.
If you start a new Recent Activity simulation, then the new results overwrite the old results. This only occurs for the Recent Activity list while the Part Operation/ Program list remains uncleared.
If you start a scenario computation or you view already computed results through View scenario clash results, the Recent Activity list results are cleared and the new results are displayed under Scenario Results.
If you recompute the toolpath of an activity, then the faults that correspond to that activity in the Part Operation/ Program list are marked as out-of-date.
Fault Item
- Displays the fault item.
Icon Description 
The fault is not analyzed. 
The fault is analyzed. 
The fault is out-of-date. The following items are available when you right-click the Fault Item header:
- Filter on Solved item
- Filter on Not solved Item
- Show All
Fault Item Fault Type Activity Name Tool Volume Time  2
2  Shank-Fixture Clash
  FACING_TOP/
  Assy1/
 0mm3 0  78
78  Holder-rough stock Clash
  FACING... HORIZ...
  Assy1/
 11.25mm3 0.4  84
84  Holder-rough stock Clash
  FACING... HORIZ...
  Assy1/
 156.73mm1 1 
 Tool-Part Clash
 Sweeping.1/ 
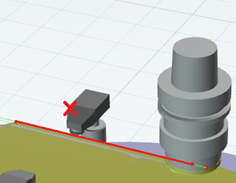
230.5 Note: When you select a line in the fault list:- The rough stock, tool, or tool shank are displayed as they were when the collision occurred, which appears in yellow. In this case, the collision area appears in red and displays a red cross in the work area where the parts are clashing (corresponding to the volume of the fault list).
- The Tool Path Information panel displays the values at the moment when the collision occurred. If Machine Kinematics is activated, the Machine Position panel also displays the values of the machine when the collision occurred. If a machining axis is out-of-limit, the axis is displayed in red.

When you click Restore default layout
 in the Simulation Options panel during
simulation, the Fault List docks under the Activities Process Tree. Once the fault list is opened, it remains open until the editor is
closed or switched.
Fault Type
The Fault Type contains the following options:
- Types of faults
-
Icon Description 
Any collision reported by the user defined in the interference probes 
Travel limit positions exceeded during simulation are stored and displayed in the fault list. They are also displayed in red in the Machine Position panel. 
- Rapid
- Maximum tool feedrate exceeded (defined on the tool)
- Maximum machining feedrate exceeded (defined on the machine)
Note: A fault is reported as soon as a cut occurs at a machining speed greater or equal to the maximum defined on the tool.
Gouge Note: The design part must be closed and this is only available for milling simulation.The fault type also displays which part of a tool (shank, holder, and so on) is in collision with which solid (rough stock, fixture).
The following items are available when you right-click a collision:
- Filter On Collision
- Show All
- Tool sweep display: Select this option to
display the tool sweep with color. You can change the display
options, such as sweep color and sweep transparency in the
Collision Report panel (available for
material removal collisions only). Note: This operation takes longer when many clashes are detected.
Clash is between:
- Non cutting part of tool, such as a shank, holder, or a non cutting area at the tool center.
- Versus rough stock or fixture.
Or
- Cutting part of tool in Rapid movement.
- Versus rough stock or fixture.
Therefore the Tool Clash is: Rapid – rough stock, Rapid – Fixture, Shank – rough stock, Shank – Fixture, Holder – rough stock, Holder – Fixture, NC Center – rough stock, NC Center – Fixture.
The following items are available when you right-click the Fault Type header:
- Filter on Travel Limit Exceed
- Filter on Tool Clash
- Filter on Gouge. See Volume.
It is possible to create the gouge solid to add measures with standard CATIA commands after leaving simulation. This is then analyzed in Shape > Digitized Shape editor. See Export the gouge solid as a CldPolygon.
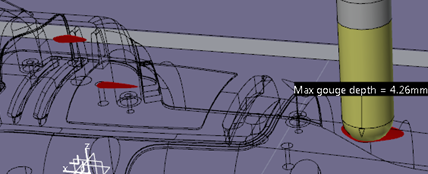
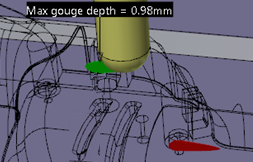
When Filter on gouge or when selecting a gouge, all gouge solids are displayed in the work area.

An arrow is pointing the current gouge solid with a max depth information. When a gouge is Set solved, the solid is displayed in green color

.When the clearance mode is activated with a positive clearance value, the fault is reported in the Fault List as a Clearance with this specific icon
 . The faults are also be filtered by a Clearance.
 When a gouge is selected, the rough stock is not displayed. To display the design, click Hide/Show Parts Elements
 in the View section of the action bar.
 - Show All
Activity Name
Shows the activities that were being simulated when the fault was detected. The icon corresponding to the activity appears.
- Activity context menu
-
The following items are available when you right-click the clash activity:
- Definition: Opens the manufacturing activity list.
- Filter: Allows you to filter the faults based on the activity.
- Show All: Displays all activities.
The menu options Previous Operation and Current Operation allow you to choose between the first and last collision activity in the fault list. They are available for link/transition collisions only.
Tool
- Tool context menu
-
The following items are available when you right-click a tool:
- Filter on Assembly
- Show All
Volume
- Volume context menu
-
It is possible to filter by volume:
- Sort Smallest to Largest
- Sort Largest to Smallest
- Show All
The volume is computed for a clash between a tool and the rough stock-fixture only during a material removal.
For others problems (Travel limit…), no volume is computed and None appears in the column.
Note: The context menu in the Volume column gives you the ability to Filter on Volume or Show All status.
Time
- Time context menu
-
Shows the simulation time when the fault was detected. This time is based on the simulated activity.
Notes:- If you perform an ISO-based simulation, an additional column appears to indicate the ISO Line that caused the fault.
- You can report several collisions at the same time and select one of the collision lines in the Fault List. In this case, the actual point of collision is indicated by a red cross in the work area and not by the machine or tool position. This case may occur when the time step used for simulation is higher than the time required for the cut duration between consecutive tool path points.
- Depending on the time step or mode chosen for simulation, the Travel Limit fault can appear several times in the Fault List.