Analyzing Paint Deposition

You can analyze the results of paint and shot peening deposition. After simulating a paint/shot peening task, you can specify the upper and lower limits in which to analyze the deposition. You can also select a specific point/area in which to perform the analysis. This option also displays additional information and a graph to indicate paint thicknesses. You can choose to view the painted areas by selecting a specific color

Surface Analysis provides tools that allow you to:

  • Automatically mark areas with given paint thickness range.
  • Manually mark an area on the surface to analyze its paint deposition.
  • Display the paint thickness for a cross section area in the form of a graph.
  • Display paint deposition by color.
  • Select a specific layer (or all layers) to analyze.
  • View the upper and lower ranges of paint thickness (informational only)
  • Select one or more products and display the paint area for the selections.
  • Display a list of analysis results from the automatic analysis.
  • Display a list of analysis results based on a selected point/area.
  • Export the results of the automatic analysis in XML format.
  • Import the results of the selected points/area to perform the analysis again.


Before you begin: Analyzed results and the information displayed are dependent on the settings in the Paint Results tab of the Simulation Options dialog box.
See Also
Analyzing Paint Results
  1. From the Surface section of the action bar, click Surface Analysis .

    The Surface Analysis dialog box appears.


  2. In the Layer Specification section, select a specific layer to analyze from the Layer list or All Layers.

    The Deposition Basics section displays Minimum Thickness and Maximum Thickness values based on the layer(s) you have selected.

  3. Click Select Products to enter product selection mode. Select one or more products in the work area to view the total painted area for the product(s) selected. Once the selections have been made, click Select Products again to exit product selection mode.

    The painted area is calculated and displayed in Total painted area.

  4. In the Areas of Interest section, specify a Lower Range and Upper Range of interest to be considered for the analysis, then click Draw Areas to perform the analysis.

    Select Mark Areas by Color to select a color from the list to be displayed in the work area.

    The results of the analysis are displayed in the work area, as well as in the Areas list. The work area is updated using color to show the areas with the least amount of paint on them, based on the range set in Areas of Interest. The minimum thickness point is displayed with a red arrow.
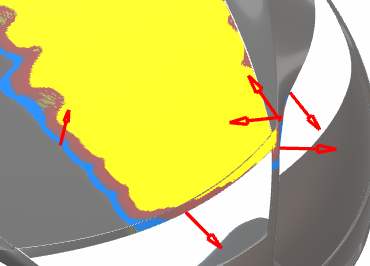
    All of these areas are included to the Areas list.
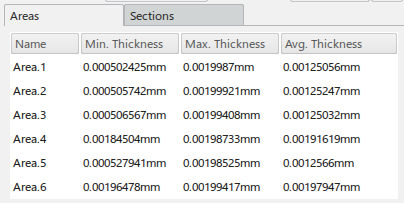
    Each area of interest is an entry in the list, and includes the Min. Thickness, Max. Thickness, and Avg. Thickness paint thickness values for each area.

    You can select an area in the list to highlight the corresponding arrow in the work area, or select an arrow to highlight it in the list.

  5. Click the Sections tab to click points of interest in the work area to analyze further.
    1. Select Pick a custom location to Analyze.
    2. Select locations in the work area.

    Each selected location is represented by a green arrow.

    Each selection is added to the Sections tab as the selection is made, and displays the paint thickness at that location.

  6. Click Delete Areas/Sections to delete the currently displayed Areas or Sections (dependent on which tab is active).
  7. Click Show/Hide Areas to toggle between showing and hiding the areas in the work area.

    By hiding the areas, the deposition (paint, shot peening) underneath can be visualized.

  8. Click Export to export an XML file to the database.

    The exported file contains two sections:

    • The results of the last computation.
    • The parameters of the computation, so the same values can be imported and applied at a later date.

    The contents of the XML file allow you to:

    • Generate a report from the XML data that contains all of the information generated from an analysis, including:
      • The specified Layer selection, along with the RGB values for the selected layers.
      • The total number of layers.
      • The minimum and maximum thickness values (stored as MKS values from the Simulation Options Paint tab).
      • The Upper and Lower Ranges used for the analysis values (stored as MKS values from the Simulation Options Paint tab).
      • The painted area value and the selected products (stored as MKS value for Area (m2).
      • The Results section List contents (all columns, stored as MKS distance value (m)).
      • The Sections section List contents (all columns, stored as MKS distance value (m)).
    • Import the data to recreate the exact same analysis.

    The Export dialog box appears, and allows you to define a name and title for the exported file.


  9. Click Import to import a Surface Analysis XML file that has previously been exported from the database.

    You are prompted to enter an Applicative Search term.

    The XML file appears in the search results.

    Select the XML file to import it into your current Surface Analysis session.

  10. Click OK to close the Surface Analysis dialog box.