-
Right-click any tag or tag group in the Trajectory Editor,
Behavior side tab, or work area and
select Add Visualization from the context menu.

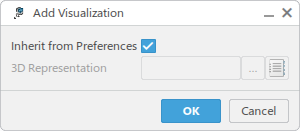
The Add Visualization dialog box appears.

By default, Inherit from Preferences is selected.
-
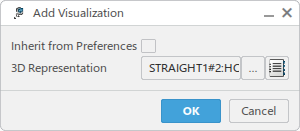
Clear Inherit from Preferences, and click … to perform an
applicative search for the graphic representation to be used.
You can also click  to retrieve the
representation from a catalog query. to retrieve the
representation from a catalog query.
You are prompted to enter a search term.

-
Enter a search term, and select a representation from the search results.
Your selection appears in the Add Visualization dialog box.

-
Click OK.
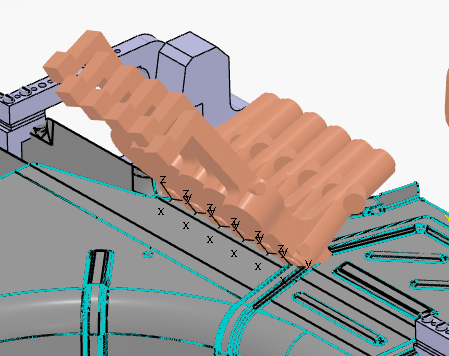
The selected representation appears at each tag.

-
Right-click the tag or tag group again and select Remove
Visualization from the context menu
to remove the visualization.

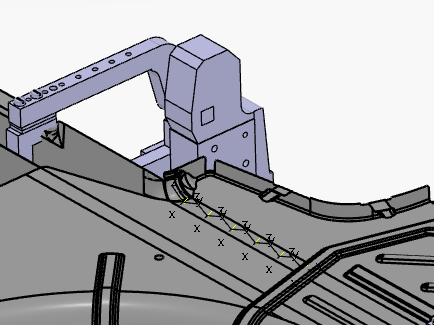
The representation is removed from each tag, and the tags appear as normal.

|