Tracking License Statistics | ||
| ||
-
Select the Statistics tab.
- Check the check box for the name of the license server:
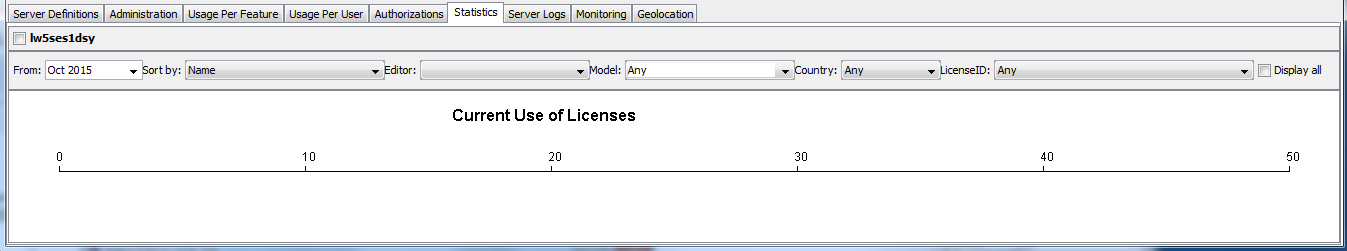
This displays the statistics tools for the selected server:

with the following options:

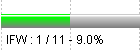
- Point to the chartbar to display a magnifying glass which in turn displays information about the licenses.
Three numbers are displayed for each feature:
- the number of currently used licenses (1 in the example below)
- the total number of currently valid licenses (11 in the example below)
- the percentage of licenses currently used (9% in the example below).
- Click the chartbar.
Another dialog box opens displaying month-by-month statistics. The dialog box displays license usage statistics over the past 12 months or more, depending on the From: value you set.
Click the chartbar for the desired month for daily information about license usage for a specific license:

Click the chartbar again for hourly information:

A tooltip containing detailed data is displayed when mousing over the vertical chartbar, for example:
July 2016 : 21 licenses used, 46 totalThe green section represents the maximum usage rate for the given period, and not the maximum used. For example, the following two statistics imply different maximum usage rates:
July 2016 : 21 licenses used, 46 totalJuly 2016 : 23 licenses used, 52 totalThe maximum usage rate is the ratio of licenses used over the total number of licenses: the highest value is always used (the first line in the above example).
The results may be unpredictable for the periods during which the server was stopped.
The main section of the Statistics tab reports the licenses currently in use, at the present moment. So the numbers displayed in this panel can go up and down, depending on instantaneous usage. When you click on a specific license (using the chartbar), you enter the historical mode, with vertical chartbars for monthly, daily or hourly usages. This provides access to the maximum usage for the given period.
Note: When statistics data collection is enabled, the files containing statistics data, with the extension.stat, are generated in the log files folder. There can be numerous files, occupying a lot of disk space, leading to increased time needed for displaying statistics in the administration tool. These.statfiles are compacted to.mstatfiles. New monthly files are generated for the months before the current month. The license server continues to generate.statfiles for the current month. The old.statfiles are moved to the StatBackup folder which you can remove.