Buckling Simulation Results | |||||
|
| ||||
Results Plots
You can view buckling simulation plots for the results values described below.
| Result Plot | Description |
|---|---|
| Deformation | Displays the mode shape without any contour plot. |
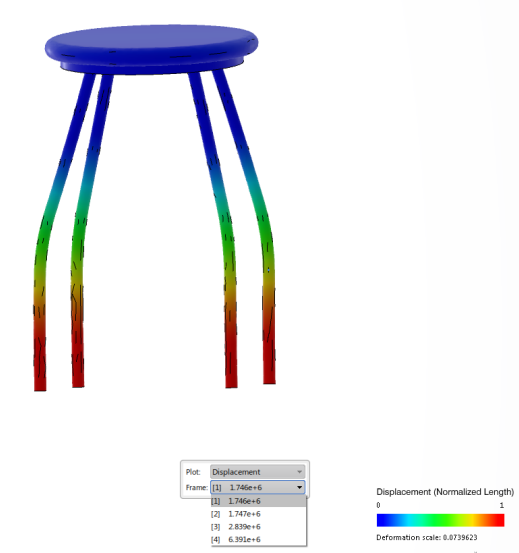
| Displacement | Contours the distance each point has moved from its original location. |
| Displacement Vector | Measures the distance each point has moved from its original location. |
Buckling Load Factors
Initially, the deformation plot displays the buckling mode shape corresponding to the first critical buckling load.

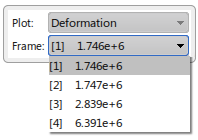
The Frame list includes all of the computed buckling load factors:

The buckling load factors and associated mode shapes are numbered [1], [2], [3], etc., up to the number of buckling modes you requested in the Simulate dialog box. Select a different frame number to change the plot display to the corresponding buckled mode shape. In many cases you may be interested only in the first mode shape and buckling load factor.
The buckling load factors are multipliers for the actual load values you applied in the simulation setup. Using the results shown above, for example, you would multiply the first buckling load factor 1.746 x 10⁶ by the magnitude of any loads you applied. If you applied a single pressure load of 5 N/m2, for example, multiply this value by the load factor to determine the first critical buckling load:
5 x (1.746 x 106) = 8.73 x 10⁶ N/m2