Display Historic and Real-Time Data

The Monitoring Console is available at: http://<HOSTNAME>:<BASEPORT+1>/perf-ui.

See Also
Troubleshoot Issues with Performance Monitoring
Identify Slow or Repetitive Queries
Build Your Own Monitoring

Context:

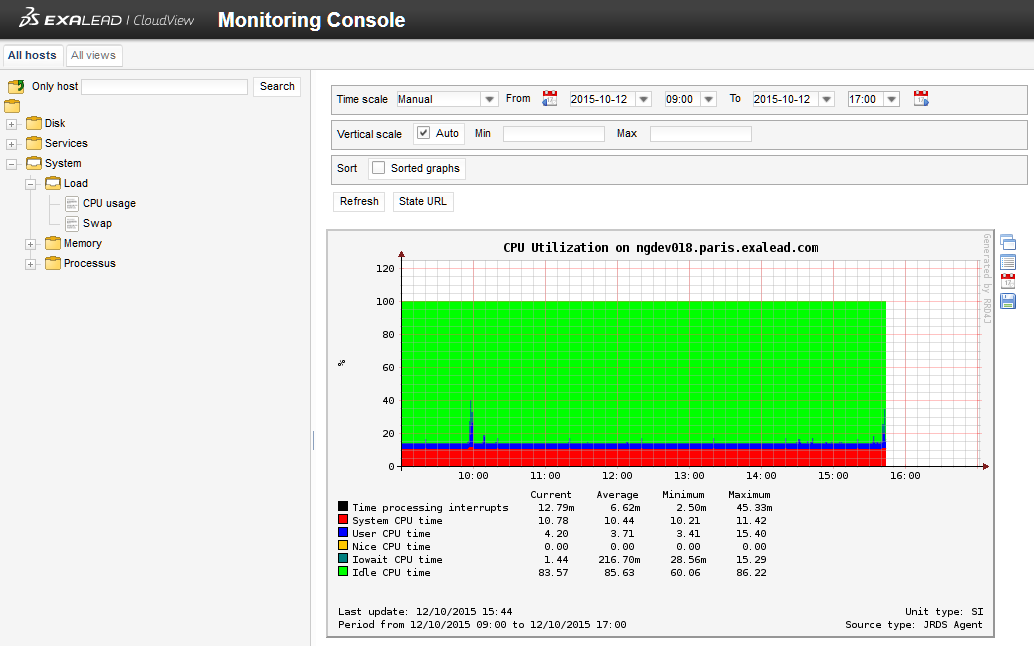
The Exalead CloudView Monitoring Console is based on JRDS ( http://jrds.fr/ ). It provides detailed system-wide performance analysis, both historic and real-time for:

  • NETVIBES services (search and indexing statistics, data structure size, etc.).

  • System statistics (CPU load, disk and network activity, memory usage, etc.).

  • NETVIBES process health (CPU usage, memory usage, IO activity, etc.).

  1. Select the:
    • All hosts tab to display performances by host.
    • All views tab to display performances by service.
  2. For each host, the tree list displays the following nodes:
    • Disk: shows the disk I/O usage
    • Services: shows the performances of internal services (EXALEAD) and the performances of the Exalead CloudView processes (JVM).
    • System: shows the performances of the host machine.


  3. To filter the graph views by date, specify a Time Scale.
  4. To filter the values of the graph ordinate (vertical axis), for Vertical scale, clear Auto and specify the min and max values to display.
  5. For each graph, you can:
    • Open the graph in a new pop-up window.
    • See the graph details in a new window.
    • See the graph history in a new window, with separate graphs for daily, weekly, monthly, and yearly performances.
    • Save the graph data to CSV. This can be useful to recreate the graph with another tool.