Step 1: Analyze Log Levels
-
Reindex.
You get the following pie chart on your search page:
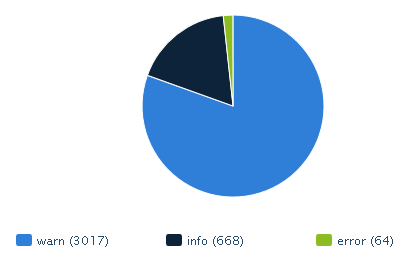
Many errors display. Let us see how we can refine our analysis.
Step 1: Analyze Log Levels
Step 2: Group Stack Traces to Refine Analysis
Our log file displays the following error: [2014/03/14-14:17:29.129] [error] [1731984037@jtp-adminui-443] [org.eclipse.jetty.servlet.ServletHandler]/ mashup-builder/mashup-ui-proxy/default/staging-builder/BzRVxU6K/downloads: java.lang.IllegalStateException: STREAM [2014/03/14-14:17:29.129] [error] [1731984037@jtp-adminui-443] [org.eclipse.jetty.servlet.ServletHandler]at org.eclipse.jetty.server.Response.getWriter(Response.java:683) [2014/03/14-14:17:29.129] [error] [1731984037@jtp-adminui-443] [org.eclipse.jetty.servlet.ServletHandler]at org.apache.jasper.runtime.JspWriterImpl.initOut(JspWriterImpl.java:191) [2014/03/14-14:17:29.129] [error] [1731984037@jtp-adminui-443] [org.eclipse.jetty.servlet.ServletHandler]at org.apache.jasper.runtime.JspWriterImpl.flushBuffer(JspWriterImpl.java:184) [2014/03/14-14:17:29.129] [error] [1731984037@jtp-adminui-443] [org.eclipse.jetty.servlet.ServletHandler]at org.apache.jasper.runtime.JspWriterImpl.write(JspWriterImpl.java:458) [2014/03/14-14:17:29.129] [error] [1731984037@jtp-adminui-443] [org.eclipse.jetty.servlet.ServletHandler]at org.apache.jasper.runtime.JspWriterImpl.write(JspWriterImpl.java:471) ..... With our current connector configuration, each row containing
| ||||||||||
