Step 1 - Configure an Aggregation Processor for Trades
-
Add an aggregation processor:
-
Select Groovy as format
-
For Name, enter Trades_UC_4
-
Click Accept
-
Replace the default code by the following one:
// Process nodes having the “trade” type
process("trade") {
   log.info "trade found for tendencies: " + it.metas.year + "_" + it.metas.country_id + "_" +
it.metas.type ;

   // default value
   it.metas.lastyearvolume = it.metas.getValue("volume");

   // Find previous year value to show tendencies
   // It is possible to build the path using a meta of the node
   for (path in match(it, "-" + it.metas.getValue("type") + "[country]" + "." + it.metas.getValue("type")
 + "[trade]" )) {
   // searching for path -export.export or -import.import or -reExport.reExport
   // Retrieve the last element of the path
   last = path.last();
   log.info "Node found: " + last.getUri();
   if ( last.metas.getValue("year").toInteger() == (it.metas.getValue("year").toInteger() - 1) ) {
   it.metas.lastyearvolume = last.metas.getValue("volume");
   }
 }
}
-
Save and apply the configuration.
Step 2 - Rescan the Trades Connector and Check What Is Indexed
-
Go to the Home page and under the connectors list, click
Scan for the
trades JDBC connector.
-
Open the Mashup UI application page:
http://<HOSTNAME>:<BASEPORT>/mashup-ui/page/searchcountry_v3
-
Search for a country, for example, Brazil or France.
-
Click the see details link.
-
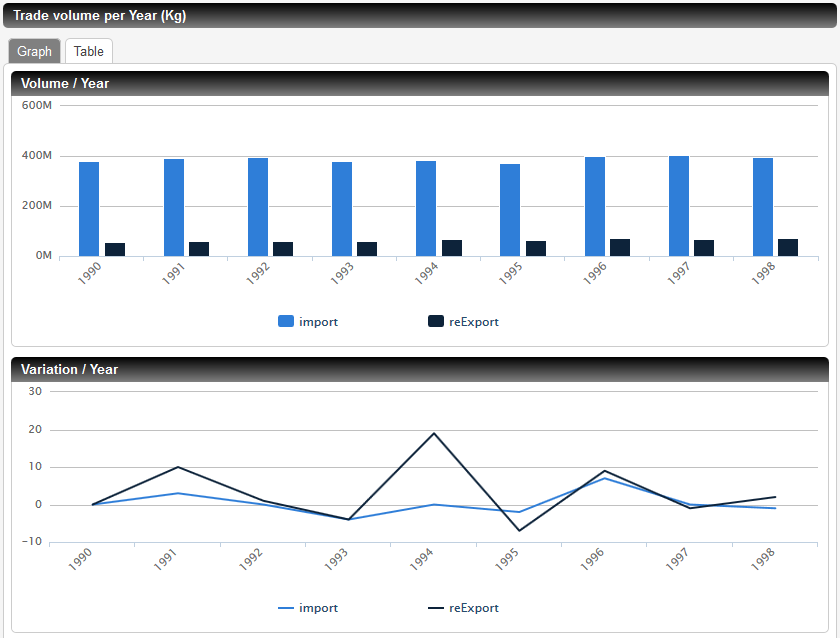
In the detail page, on the Trade volume per Year (Kg) tab, check the Variation / Year graph.
-
You can also go to the analytics page:
http://<HOSTNAME>:<BASEPORT>/mashup-ui/page/analytics_v1
This page provides various graphics. Choose the Trades tab. For each Export / Import
and Re-Export tabs, you can see the trends for each year.

|