Defining the Refinement Facets

Use navigation facets to filter search results and navigate through them. By default, they display in the Refinements panel of the Mashup UI, with a count of documents but you can use other calculations.

Navigation facets can also be displayed in charts and table widgets, where you can perform similar refinements. For example, when clicking a pie chart slice, the view is refined to focus on the slice details.

Note: For more information, see Creating Facets to Refine Search Results in the Exalead CloudView Configuration Guide.

This task shows you how to:

Tutorial: Enhance the Refinement Facets Display

We do not need the Source and Data model class facets in the Refinements panel, as we have only one source and one class. We want to hide them to reduce the number of facets.

  1. In the Administration Console, go to Search > Search Logics > sl0 > Facets.
  2. For the dataModelClassHierarchy facet, deselect Use for navigation.
  3. Repeat this action for the Source facet.
  4. Click Apply.
  5. Go to the Mashup UI search page: http://<HOSTNAME>:<BASEPORT>/mashup-ui /page/search?q=
  6. Refresh the view.

The Data model class and Source facets have been removed from the Refinements panel.
Tutorial: Add a Numerical Range facet for Unit Prices

For our tutorial, we are going to create a virtual numerical facet to organize search results by price ranges. We want to define a fixed size for all ranges, to show included units by ranges of 20 (and get $1-21, 21-41, etc.).

To get more examples with other facet types, see Tools for Analytics.

Create the Numerical Range Facet

  1. In the Administration Console, go to Search > Search Logics > Facets.
  2. Click Add facet.
    1. Specify a Name, for example price_range
    2. For Type, select Numerical ranges.
    3. Click Accept.
  3. Clear Use for hit content, as we want this facet to display only for navigation in the Refinements panel.
  4. For Expression:
    1. Click Edit
    2. Double-click sales_unit_price to insert it to the Expression field
    3. Click Accept.
  5. For Sort by, select Range.
  6. For Create ranges, select that are the same size.
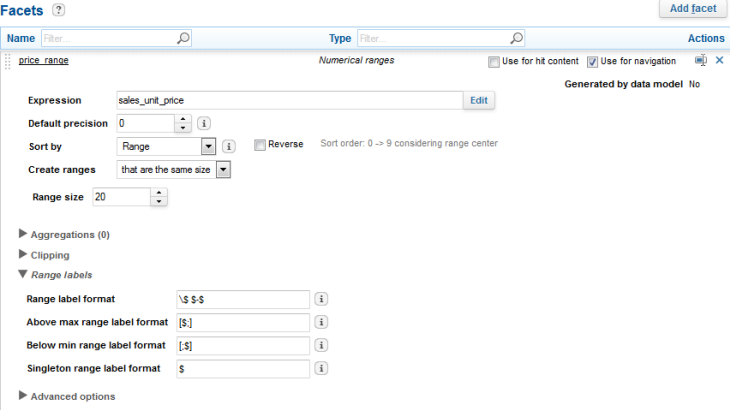
  7. For Range size, enter 20.
  8. We want to display price ranges separated by a dash (for example, $21-41). By default, values are displayed between square brackets separated by semicolons, for example, [$21;$41]).
    1. Expand Range labels.
    2. Set Range label format to: \$$-$

    The facet configuration must be the following.

  9. Click Apply.

Check the Range Facet Display

  1. Go to the Mashup UI search page: http://<HOSTNAME>:<BASEPORT>/mashup-ui /page/search?q=
  2. Remove nylon from the search bar and click Search.

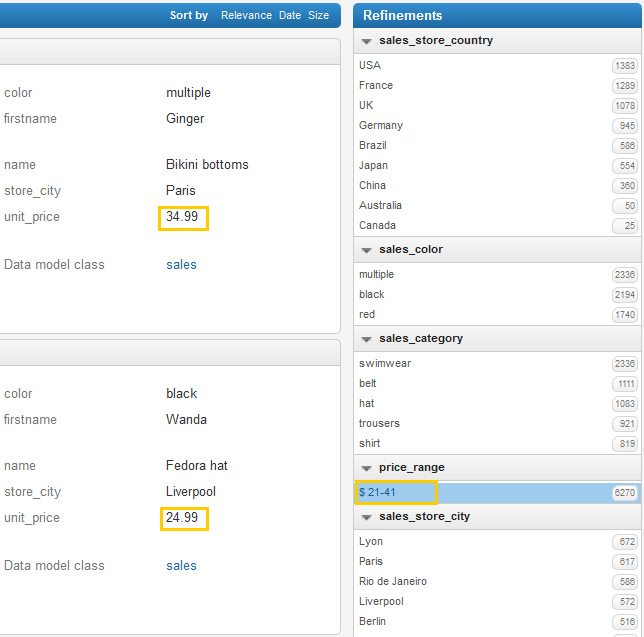
    In the search results, the price_range facet is now displayed in the Refinements panel.


  3. Click a range, for example 21-41.

    The results are refined to show hits with unit prices included within this range.

To display all ranges again, click the refined range.