Tutorial: Enable Drill-Down Using Hierarchical Facets

In the previous section, we added a widget that displayed revenue by country on the Mashup UI. The next logical step is to add the ability to drill-down on country so we can view revenue by city as well.

We need to create a hierarchical facet that takes the form Top/ClassProperties/Country/City.

  • Top/ClassProperties is generated automatically when you add a new property to the Data Model as a facet.

  • Country/City will be generated by concatenating the store_country and store_city metas.

Since concatenation is a more advanced type of document analysis, we will need to configure a new document processor to do this.

Note: The Pie Chart widget used in this section is only available in Mashup Builder Premium.

This task shows you how to:

Configure the Concatenate Values Document Processor

Context:

Document processors analyze document metas, then output them as contexts, which you can then define as index fields and as facets in the Data Model.

Up until now, when you added a new property to the Data Model, there were processors already in place to perform the required document analysis.

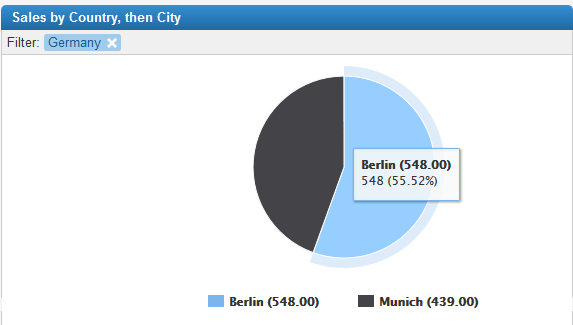
To be able to drill-down from country to city, however, you must create a facet that emulates a hierarchy. Facets created in the Data Model have this value in the Index: Top/ClassProperties/<FACET NAME>

To make a hierarchical facet, you need to add another level, to denote the child facet, separated by a "/" from its parent: Top/ClassProperties/<PARENT FACET NAME>/<CHILD FACET NAME>

  1. In the Administration Console, go to Index > Data Processing > ap0 > Document Processors.
  2. Go to the Processor types list and expand Text operations.
  3. Drag the Concatenate Values document processor to the end of the Current procesĀ­sors list.
  4. Expand the processor and complete its fields:
    1. Output to: sales_country_city
    2. Join: /
    3. Input from: sales_store_country
    4. Input from: sales_store_city
  5. Click Save.

We now need to add a new property to the sales class that will use the sales_country_city output meta.

Add a New Data Model Property Using the Output Meta

  1. Go to Index > Data Model.
  2. Select the sales class.
  3. Click Add property.
    1. Name: type country_city
    2. Data Type: select Alphanum
    3. Semantic Type: select metadata
    4. Field Type: select Facet only
    5. Click Accept.
  4. Click Apply.
  5. Go to the Home page, Clear the index.
  6. Once cleared, click Scan for the sales connector.

Configure the Display of the Hierarchical Facet

  1. In Mashup Builder, go to the /search page and select Design.
  2. From the Widgets panel, select Visualizations > Charts.
  3. Drag the Pie Chart to the /search page so it is just below the Navigation Header widget.
  4. Click the widget header and on the widget properties panel, specify the following:
    1. In Widget Title, type Sales by Country, then City.
    2. In Facet, select sales_country_city.

    Note:

    If you do not see this facet on this list, click the Reload icon at the top of the list.

  5. Click Apply.

View Your Changes

  1. Go to the Mashup UI.
  2. Refresh the screen.
  3. When you search for shirt in the Mashup UI, a pie chart now displays in the search results.


    When you click a slice, the chart drills-down to the cities belonging to the parent country.