Analyzing and Verifying Interference Simulation Results
You can
analyze the results of an interference simulation or the required
interference simulation metrics and verify them.
Before you begin: Open an interference simulation or an interference simulation
metric. To do so:
Search the required interference simulation, the interference metric, or
the filter applied on interference simulation and drag it to the widget or
dashboard of the Interference Check for Dashboard. You can select several interference metrics.
Notes:
If you select the interference simulation and interference
metric, interference simulation is considered.
If you select the filter created on an interference simulation,
the filtered parts are considered.
If you select several interference simulations, the interference
selected at first is considered.
If you select interference simulation metrics from several
interference simulations, the metric corresponding to already
open interference simulation is considered. If no metrics belong
to the already opened interference simulation, you can choose to
cancel the opening of the interference metrics and keep the
current interference simulation.
When no interference simulation is open and you select
interference simulation metrics from several interference
simulations, the interference simulation corresponding the
maximum number of the selected metrics is considered.
Drag the interference metric from an interference result list if an
interference simulation or interference metric is already open in another
widget or dashboard.
Note:
When you drag several interference metrics from the interference
simulation result list, the interference simulation selected at first is
considered.
From the
Interference section of the action bar, click Analyze Interference.
The interference simulation result list appears with colors associated to User Status and
Analysis Status.
Note:
When the widget width is smaller than 550 pixels,
the interference simulation result list hides automatically when you select
the row.
If you select the User Status,
Analysis Status,
Description, or the Metric
Name, the interference simulation result list does not
hide automatically.
You can reorder the columns and hide them if required. You can also sort the
columns alphabetically. These modifications persist
after browser refresh.
From the Interference section of the action bar, click Color Overload to
apply colors to the interfering parts.
The status of the Color Overload
command (activated or deactivated) is stored in the local storage of a browser.
Thus, when you analyze the interference simulation, the previous activation
status is restored.
Select the required interference from the interference simulation result list.
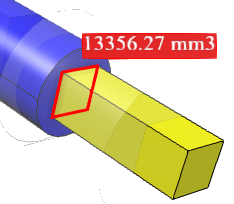
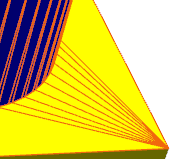
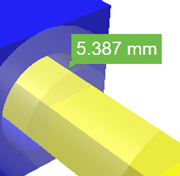
The 3D geometry is re-framed displaying the interference curves for
clash or contact interferences. The
annotation on the selected interference instance for clash or clearance appears.
If you select
several rows, in case of color overload conflicts, the color displayed for
the interfering part is based on the last selection.
Notes:
The curve computation stops after five seconds if it takes
longer time to display the interference curves. An information
message is displayed notifying the same.
When you open a metric, only interfering parts of that metric
are opened.
For more information about colors
corresponding to analysis status in the interference list, see Attribute Columns.
Clash (Penetration Volume and Vector)
Clash (Penetration Volume)
Contact
Clearance
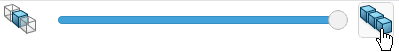
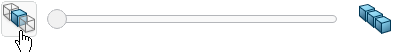
Move the slider to adjust the opacity of the objects that are not a part of the
selected metric.
By default, the opacity is 10%. The modified opacity value is persisted.
Applying Full Opacity
Applying Full Transparency
Click to apply full opacity (the opacity value of
3D objects) to non-interfering objects. Click again to apply the previous opacity value.
Click to apply full transparency to
non-interfering objects. Click again to apply the previous opacity value.
When you reopen the interferences using Analyze
interference, previously selected interferences are selected and previously
applied opacity is applied.
You can also specify the transparency value in the
Transparency box under
Interfering Parts, available at Me > Preferences > App Preferences > Social and Collaborative> Global Design Management > Interference Check > Interference Display.
Create a change request for the interference metric.
Create an issue for the interference metric.
Select the required values from the User status and the
Analysis status lists based on the analysis of the
selected interference.
You can select several instances and change their analysis status.
Optional:
Enter a comment in the Description box.
You can also change the contextual name.
To generate an interference simulation report in a
CSV file, right-click the interference simulation result list and
select either of the following:
Export to CSV > All Visible
Interferences: To export all the visible interferences in
the interference simulation result list.
Export to CSV > Selected
Interferences: To export
the selected interferences in the interference simulation result
list.
To play the Interference Check for Dashboard experience in 3DPlay Web App, from the Compass, click 3DPlay Web App.
Optional:
To create an issue, drag the metric to Issue Management.
For more information about issue creation, see Issue Management User's
Guide: Creating Issues.
Optional:
To add a metric as an attachment to the task, drag the metric to the
Attachment box of the task.
For more information about task creation, see Collaborative Tasks User's
Guide: Creating a Simple Task.
Optional:
From the Tools section of the action bar, click Filter to create a filter with selected
components of the product.
 .
The interference simulation result list appears with colors associated to User Status and Analysis Status.Note: When the widget width is smaller than 550 pixels, the interference simulation result list hides automatically when you select the row.
.
The interference simulation result list appears with colors associated to User Status and Analysis Status.Note: When the widget width is smaller than 550 pixels, the interference simulation result list hides automatically when you select the row. to
apply colors to the interfering parts.
to
apply colors to the interfering parts.

 to apply full opacity (the opacity value of
3D objects) to non-interfering objects. Click
to apply full opacity (the opacity value of
3D objects) to non-interfering objects. Click  to apply full transparency to
non-interfering objects. Click
to apply full transparency to
non-interfering objects. Click