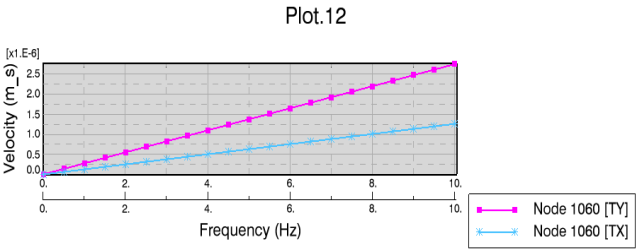
Modify Curve Options Except Associating Axes
You can modify the legend and appearance of curves in an XY plot.
| Important: For negating curves, see Negating Curves. |
-
Right-click the chart where you want to modify the curve
options, and select
Options.
If the chart you want to work in is the active one, you can also, from the Plot toolbar, click Options
 .
The Options dialog box appears.
 - Select the item Curve.
-
In the
Curve list, select the curve you want to
modify.
All your following modifications will be applied to the selected curve until you select another curve.
-
To remove the selected curve, click
Remove Curve.
Tip: You can also remove a curve by right-clicking the chart and select Edit > Remove Curve. -
To modify the display unit for the curve, do the following:
-
In the
Unit column, click the unit for the
curve.
A list appears for the unit.Note: The default unit is indicated by the text Default after the unit.
- Select unit from the list.
The display unit is changed in the dialog box and in the curve legend.Note: If you want to change the display units themselves, you do this from Me > Preferences > App Preferences > 3D Modeling
> Multi Discipline Automated Engineering > Knowledge
Basics, the
Units tab.
-
In the
Unit column, click the unit for the
curve.
-
To modify the name of the selected curve, edit the text in the
Name text box:
The default curve name is, for example, in the case of a 2D display for a dynamic solution, composed of the number of the selected node and the selected component.
- To change the default name to a new name, type the new name.
- To revert to the default name, clear the text box.
- Optional:
To remove the appended unit for the curve in the legend, clear
Append unit.
By default, Append unit is active.
-
Modify the display properties of the line that represents the
selected curve.
- Optional:
To hide the line that represents the selected curve, clear
Show line.
By default, Show line is active. It must be active when you edit the below.
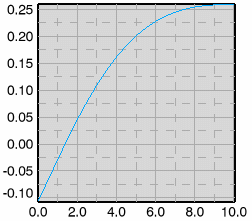
Default curve display:
Result if Show line is cleared:

- Modify the color, the thickness, and the line type of the curve line.
- Optional:
To hide the line that represents the selected curve, clear
Show line.
-
Modify the display properties of the symbols that represent the
values of the selected curve.
- Optional:
To hide symbols on the curve, clear
Show symbol.
By default, Show symbol is active. It must be active when you edit the below.
For result, see figures below.
- Modify the color and the symbol type.
-
Activate
Frequency to display the symbols with a
selected frequency, and select the frequency.
By default, Frequency is active with the value 0, meaning that no values are marked with symbols.
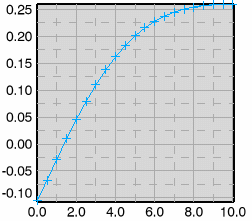
Note: Frequency and When Y changes cannot be active at the same time.An example:Curve if frequency equal to 0 (default), or if Show symbol is cleared:

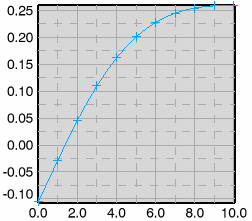
Frequency equal to 1:

Frequency equal to 2:

-
Activate
When Y changes if symbols should only
appear when the Y axis change.
By default is When Y changes cleared.
Note: When Y changes and Frequency cannot be active at the same time.
- Optional:
To hide symbols on the curve, clear
Show symbol.
- Optional: Associate axes. For associating axes, see below.
- To confirm the modifications and close the dialog box, click OK.

