Analyzing Surface Curvature | |||
| |||

-
From the
section of the action bar, click Surfacic Curvature Analysis
 .
.
-
Select a surface.
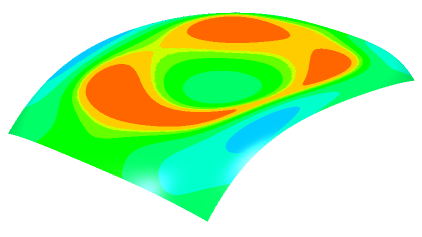
The surface is painted according to the color scale in the dialog box.

-
Adjust the color scale: In the Color scale dialog box,
click Use Min Max.
- The maximum and minimum values in the dialog box are specify according to the values detected on the surface.
- The analysis colors are updated to match the color scale in the dialog box.
-
Show gaussian curvature information on all parts of
the surface:
-
In the Options area, click On The
Fly
 .
.
- Move the cursor over the surface.
At the position of the pointer, the following information is displayed:- The local gaussian value of the curvature ( The Gaussian type is selected in the Type area).
- The direction of the maximum curvature.
- The direction of the minimum curvature.
-
In the Options area, click On The
Fly
-
Show minimum/maximum/mean curvature information on all parts of
the surface:
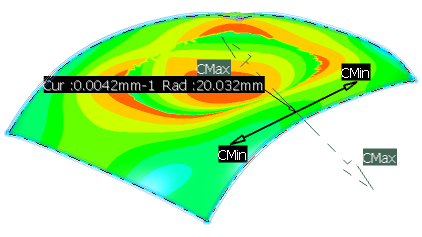
- In the Type area, select Minimum, Maximum, or Mean.
- Move the cursor over the surface.
At the position of the pointer, the following information is displayed:
- The local minimum, maximum or mean value of the curvature (according to your selection in the dialog box).
- The local radius of curvature or mean radius of curvature (according to your selection in the dialog box).
- The direction of the maximum curvature.
- The direction of the minimum curvature.
Important: The color scale does not change when you switch from one analysis type to another analysis type (except for Limited and Inflection Area types), or to another element. This facilitates comparison of curvature because each analysis or element can be viewed using the same reference colors and values. -
Show the position of the maximum and minimum values:
-
In the
Options area, clear
On The Fly
.
- Click Show MinMax .
The position and value of the maximum and minimum values is displayed.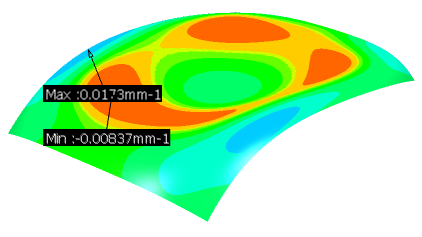
-
In the
Options area, clear
On The Fly
-
Define a radius limit and reduce the number of colors in the color
scale:
- In the Type area, select Limited .
-
In the
Options area, click
On The Fly
.
- In the Limited Radius options area, enter the radius value or use the arrows to change it.
The values in the color scale dialog box are updated automatically.Minimum curvature and radius values are displayed.

-
In the Type area, select Inflection
Area.
This analysis enables you to identify the curvature orientation:
- Green: Areas where the minimum and maximum curvatures have opposite orientations.
- Blue: Areas where the minimum and maximum curvatures have the same orientation.
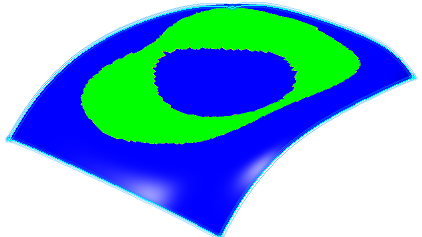
Note: Inflection lines created during Inflection Lines analysis are always created within the green area. -
In the Type area, select Symmetric
Gaussian. Select the required parameters.
-
In the color scale dialog box, click Use
Max:
- The maximum value in the dialog box is specified according the values detected on the surface. Zero Threshold is not modified unless it becomes larger than Max Value.
- The analysis colors are updated to match the color scale in the dialog box.
Note: You can also manually enter the values. -
Select one of the following options under Color Scale Variant
area:
- Body: specifies the zero threshold at 0.00000002 and the max at 0.0000004.
- Default: specifies the zero threshold at 0.0000000001 and the max at 0.0001.
The result is the same as the result for the Gaussian type.
The color range contains 11 colors on the positive side, 11 colors on the negative side, and pink color
indicating zero in the middle.Note: To change the total number of colors, right-click any of the color icons, select Number of Colors, and enter a value between 1 to 15 in the Number of Colors dialog box.
color
indicating zero in the middle.Note: To change the total number of colors, right-click any of the color icons, select Number of Colors, and enter a value between 1 to 15 in the Number of Colors dialog box. -
In the color scale dialog box, click Use
Max:
-
In the Type area, select Flat
Region.
The threshold value is calculated based on the values specified for chord length and height.
The surface is colored as follows:
- The areas with curvedness value greater than the threshold value gets
red
 color.
 - The areas with curvedness value less than the threshold value gets blue
 color.
- The areas with curvedness value greater than the threshold value gets
red
-
In the Type area, select Shape
Index.
The range of color scale is from -1 to 1. The colors and values are fixed.
The plane shape is colored pink
but
pink color is not available in the color scale dialog box.