-
From the Analysis section of the action bar, click Highlight Lines
Analysis
 . .
-
Select one or more surfaces to analyze.
-
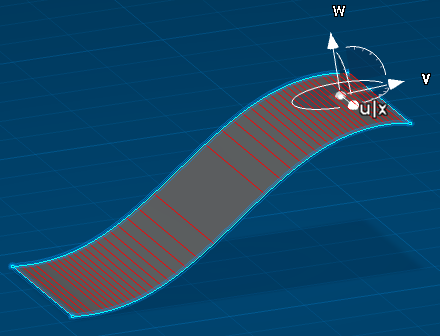
Select the highlight type.
- Tangent: The system draws a series of curves on
the surface. At all points along a given curve, the angle between the
local principal tangent to the surface and the Robot Z or W axis is constant. The
angular spacing between each curve is given by the Angle
Pitch value. The origins of the curves are the points on
the surface at which the Robot Z or W axis is normal.
- Normal: The system draws a series of curves on
the surface. At all points along a given curve, the angle between the
local normal to the surface and the Robot Z or W axis is constant. The
spacing between each curve represents a change in the angle of the local
normal given by the Angle Pitch value. The
origins of the curves are the points on the surface at which the Robot Z or W axis is normal.
Right-click a line to convert it into a curve. The curves appear in the tree as datum elements.
-
Click
OK. The analysis
is added to the
tree
and will be updated automatically whenever you modify any of the input
elements.
|