Analyzing Using Isophotes | ||||||
|
| |||||

-
From the Analysis section of the action bar click Isophotes Mapping
Analysis
 .
.
-
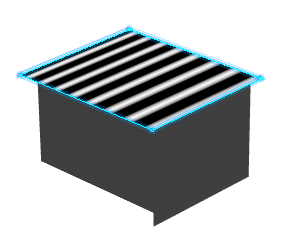
In the Type Option area, select Cylindric
Mode
 .
.
-
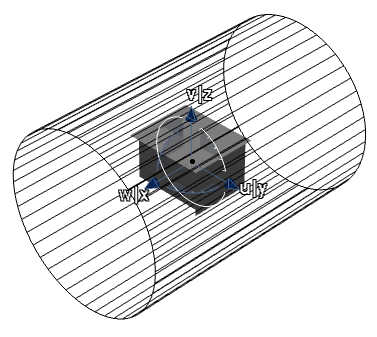
Click a surface in the work area.
The Isophotes representing cylindrical zebra stripes are applied on the surface.
-
Select Analysis mapping on part
 .
.
Isophotes are displayed on all surfaces of the part, irrespective of whether they are selected or not.
Note: If you want isophotes on all of the part in the work area, use this method of global selection rather than using a trap.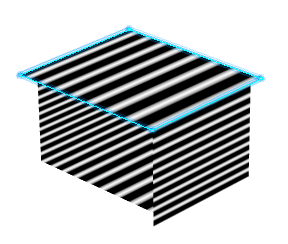
-
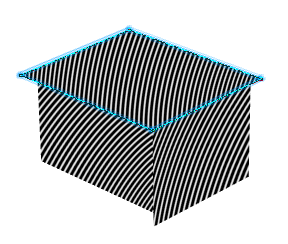
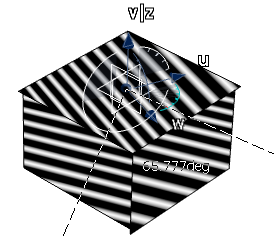
Select Spheric Mode
 .
.
Isophotes representing spherical zebra stripes are applied on the surface.
-
In the Zebra parameters area, select
Robot
 .
The Robot is repositioned at the center of the reference planes and a representation of the spherical 3D handle is displayed with its center located at the base of the Robot.
.
The Robot is repositioned at the center of the reference planes and a representation of the spherical 3D handle is displayed with its center located at the base of the Robot.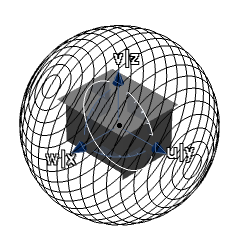
-
Select Cylindric Mode again.
The 3D handle changes to a cylindrical shape.
- In the Zebra parameters area select
Hide the 3D manipulator
 .The 3D handle disappears, but the Robot remains in the work area.
 -
Manipulate the Robot to modify the orientation of the hidden 3D handle.
Because the 3D handle orientation has changed, the orientation of the isophotes also changes.
-
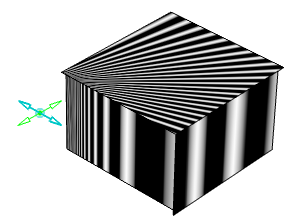
In the Type Option area, select User
eye
 .
.
Note that Point Mode
 is
selected automatically.
is
selected automatically.- The User eye handle appears and it allows you to define another point of view independently from the screen point of view.
- You can move the Eye User by dragging along its
axes or by dragging its center.
The isophotes mapping is modified according to the Eye User orientation.
Note: If you right-click the Eye user handle, a context menu appears which allows you to Edit its position or Keep this point.