Visualising boreholes | |||||
|
| ||||
The Geoscience Interpretation app displays boreholes properties as intervals and customises all data that appears: default colour, collar style, borehole name orientation, and font size of labels.
You can display borehole intervals according to:
- Colour trace: As a coloured line thicker than the core line of a borehole.
- Cylinders: As a fixed-size cylinder with a customised diameter width.
By default, boreholes appear as a: black line, marker as collar, and vertical borehole ID.
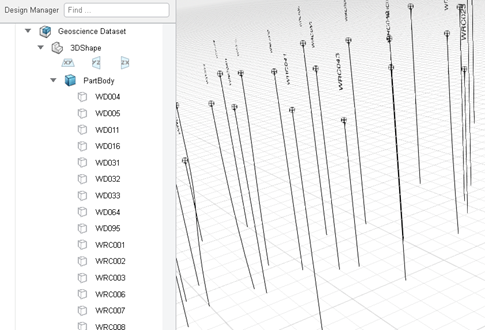
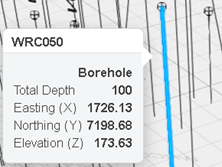
When you click the borehole marker and hover over the boreholes, you can view data: ID of the borehole in the header, the type of the selected object, and coordinates.
When you click a borehole interval, the selected object is highlighted, and you can view data about the interval: the ID of the borehole in the header, the type of the selected object, depth, value, and field.
