Mapping Spatial and Tabular Data

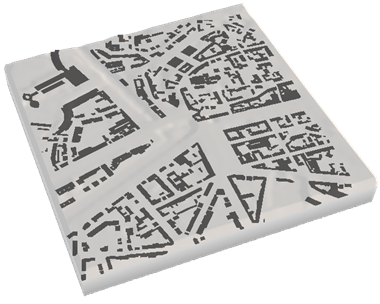
You can create a mapping between a geolocated datasource (a SHP or a GeoJSON file) and data contained in a tabular file when creating prepared datasets.

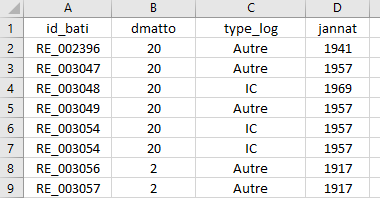
Tabular data are datasets which cannot be related to a location on the Earth's surface, thus referred to as "non-spatial data". This can be, for instance, datasets representing cadastral land lots with information related to lot details located in tabular files.


Before you begin: :

  • The tabular file must be in CSV format within an ENOVIA document. Other formats are not supported.
  • The tabular file must be compliant with the OGR CSV driver specifications. For more information, see https://www.gdal.org/drv_csv.html.
  • The spatial file is the master file. This means that the mapping can be carried out only if the value contained in the spatial file also exists in the tabular file. Otherwise, no tabular information is added.

See Also
Displaying Object Properties
  1. From the Referential section of the action bar, click the command of your choice to create a prepared dataset.

    In our example, we run the Create Simple Feature command.

  2. From 3DSearch, drag the appropriate file onto the "drop source data here" zone displayed on the referential.
  3. In the dataset creation dialog box, select the Output Attributes box in the Exposed Attributes area to expose all attributes at once.
    This means that all attributes will be displayed in Attributes list of the Properties panel.
  4. From 3DSearch, drag the document containing the tabular file onto the Tabular Linkage area at the bottom of the dataset creation dialog box.
    Tabular File Example

  5. In the Source Attribute and Tabular Attribute lists which are now displayed, select the attributes to be linked together.

    Important: Do not map a Source Attribute that contain an empty column, otherwise the attributes will not be displayed in the City Attribute Table.

  6. Click OK.
    The dataset is created.
  7. From the Available City Datasets area of the City Referential panel, drag the created dataset to the referential when the status switches to Ready.
    The dataset is displayed in the tree on the left and the associated image appears on the selected referential.
    Simple Feature with Polygons

  8. From the standard section of the action bar, click Properties .
  9. Expand the GIS attributes area.
    The following information is now displayed:
    • attributes contained in the geolocated file
    • attributes contained in the tabular file with the name of the original CSV file.
    Mapping Example

    (1) Exposed attributes of the geolocated file

    (2) Attributes defined in the tabular file