You can highlight areas of concentration on your map so that
patterns of occurrence (such as road traffic accidents, or store locations)
that are higher than average can emerge.
Before you begin:
This functionality is relevant for prepared simple features with
points.
You can create only one heatmap and visualize only one layer of points at a time.
Heatmaps are intended for live display only, they are not saved in
the experience.
Heatmap rendering might be less accurate when you are far away from
a dataset with a high number of points ( > 900) because clusters will only
take care of points with the highest influence.
Click Play to watch the video:
You can either:
Select a valid dataset, and then click Heatmap from the Tools section of the
action bar
Directly click Heatmap from the Tools section of the
action bar, and then select a valid dataset from
the Dataset list.
The heatmap is displayed using default parameters.
Recommendation:
If the heatmap is still displayed even though the
dataset is hidden (that is, the corresponding box is cleared in the tree),
select the box in the tree, and then clear it again.
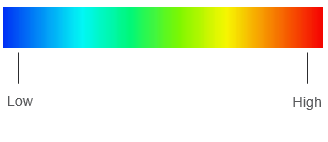
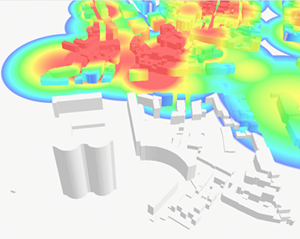
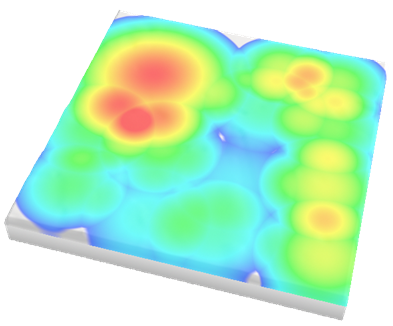
Each visible
point or cluster of points is represented as a fuzzy circular area in the
experience. This area of influence is defined in meters around the point or
cluster with a color gradient to emphasize areas with a high density of
points: the stronger the color, the higher the density of points.
Important:
Only one heatmap can be created for a given experience
and only one layer of points can be visualized at a time.
Zoom in to the area of interest.
In the
Heatmap panel, use the
Radius box to adjust the radius size to the
appropriate value.
This value refers to a point radius and impacts the cluster
radius (which is computed from the cluster points and the default point
radius).
Use the
Opacity slider to define how transparent the
colors are.
In the
Magnitude list, select the attribute to be
used as magnitude.
This lets you adjust for each pixel on screen how much all points
contribute to the look of your heatmap by multiplying each point intensity by
the value corresponding to the selected attribute.
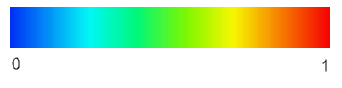
Once all contributions are computed for a pixel, the resulting sum
is converted into a color using a dedicated color gradient. To map the
contributions to the color gradient, the sum of contributions for each pixel is
divided by the total number of points in the layer (or the total magnitude). It
gives a ratio between 0 and 1.
Moreover, while the opacity is set for the heatmap layer, it is
also forced transparent smoothly for the range [0;0.05] to get smoother
transitions.
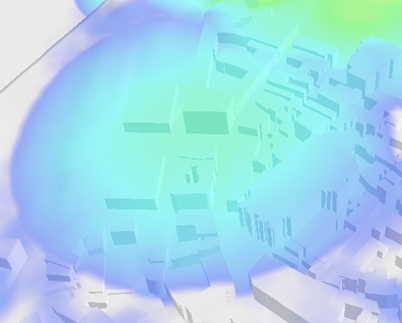
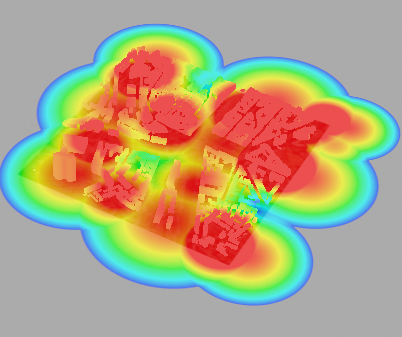
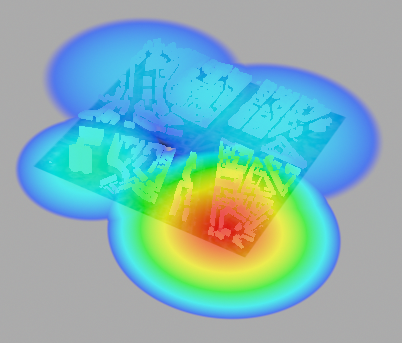
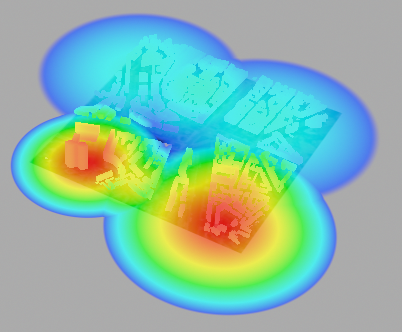
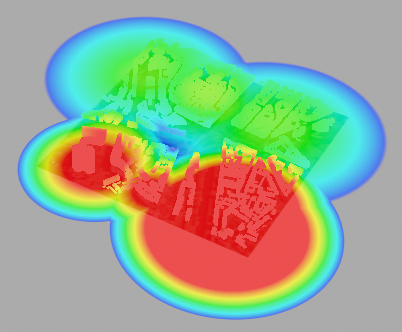
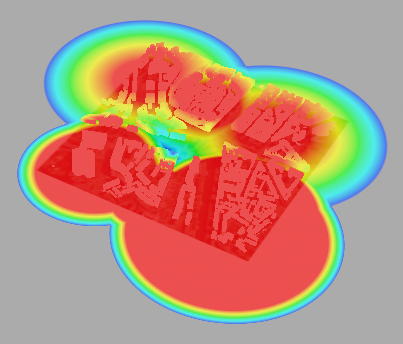
Below are two examples of the same experience with two different
attributes.
Attribute 1 Attribute 2
Important:
By default, there is no magnitude. In that case, all points
have an intensity of
1 which means that they all have the
same influence.
At least one numerical attribute must have been exposed for
the selected dataset, otherwise the
Magnitude list only displays
NO MAGNITUDE.
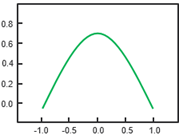
In the
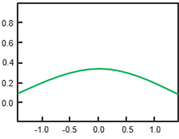
Kernel list, define how the computation
decreases by selecting the appropriate kernel smoother:
Kernel
Description
Epanechikov
This kernel is defined on the point circular area and
provides a more punctual repartition of the color distribution.
Gaussian
This kernel gives smoother results and a
more widespread repartition because it has no bounds.
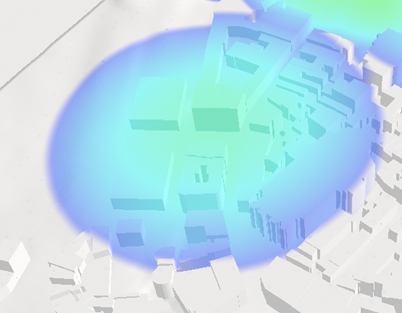
Use the
Bound min slider to raise the lower range to a
value greater than 1 (default value) to give more importance to areas with
small contributions.
All points having a contribution lower than 10 will be
automatically set to 10.
Bound min = 5 - Bound max = 80 Bound min = 10 - Bound max = 80
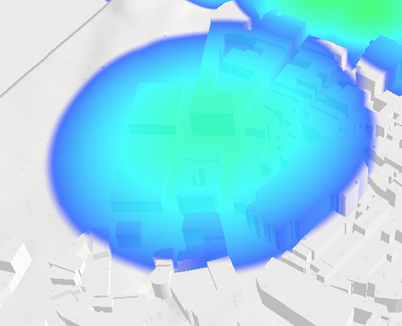
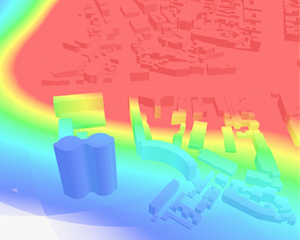
Use the
Bound max slider to define the upper range on
the color gradient for close views with only a subset of points.
For instance for a given view where only 100 points out of
100 000 are visible, the default parameter will give a quite transparent/blue
rendering. Setting the parameter to 50 means that all the pixels that have a
contribution of at least 50 will be set as red instead.
Bound min = 5 - Bound max = 20 Bound min = 5 - Bound max = 80
Tip:
Depending on the zoom level and on the chosen point
of view, you might need to tune the
Bound min and
Bound max values to obtain an appropriate
rendering (for sharing snapshots, for instance).
 from the Tools section of the
action bar
from the Tools section of the
action bar
 Recommendation: If the heatmap is still displayed even though the dataset is hidden (that is, the corresponding box is cleared in the tree), select the box in the tree, and then clear it again.