Mechanical Deformation | ||
| ||
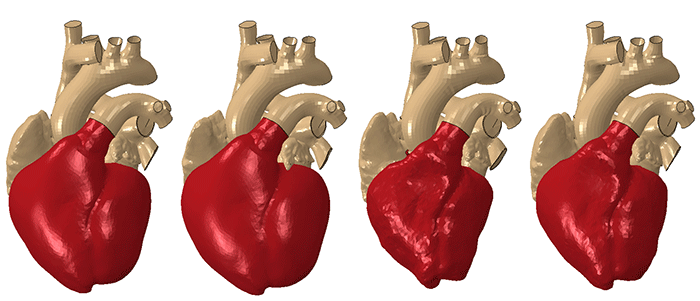
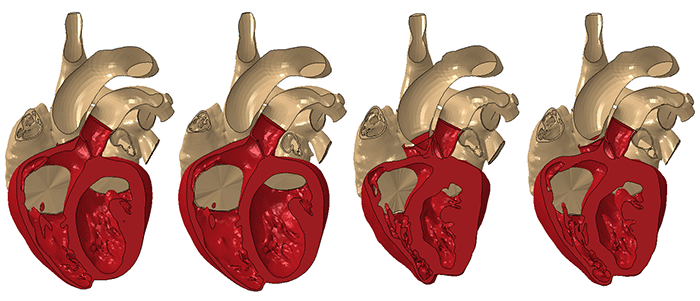
The figures below show the heart deformation at select times during the analysis (with valves removed from the display).


The figures below show the heart deformation at select times during the analysis (with valves removed from the display).
| |||||||