Electrical Analysis | ||
| ||
The electrical analysis is performed using the Heat Transfer procedure in Abaqus/Standard because the governing equations for electrical conduction are equivalent to those used for diffusion heat transfer. Consequently, any references to temperature in the documentation or results files (including ODB output quantity NT) actually represent electric potential.
A single analysis step named BEAT is defined in the ELEC model. The duration of the cardiac cycle is 1 second, but the electrical event (from the onset of depolarization to the end of repolarization across the entire heart) is complete after 500 ms. Thus, for efficiency purposes the electrical simulation is run for only 500 ms. Since the electrical analysis results are used to provide an excitation to the mechanical analysis, the output variable for electrical potential (that is, temperature NT) is specified as field output.
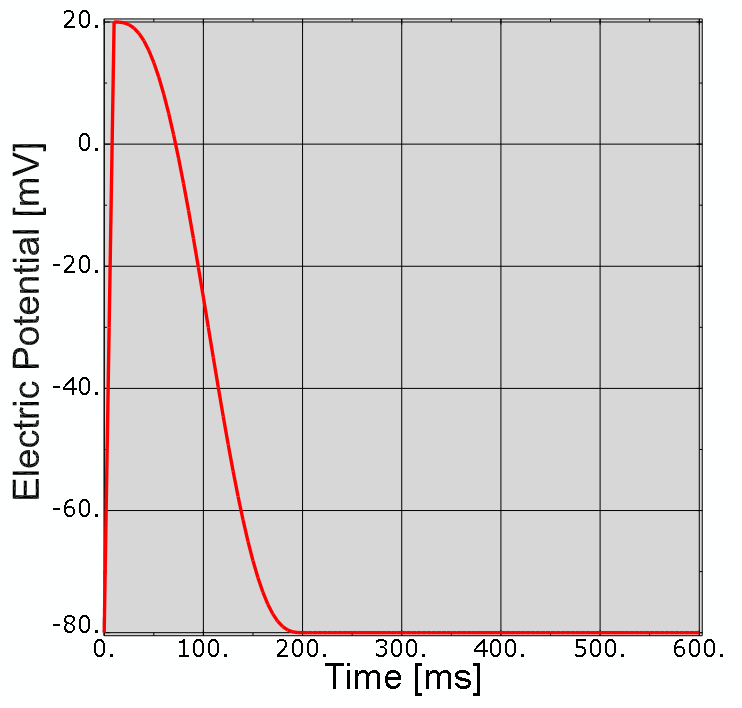
During the BEAT step, an electrical potential pulse (shown in the figure below) is applied at a node set representing the sinoatrial (SA) node (node set: R_Atrium-1.SA_NODE). The electrical waveform is created using the Smooth Step amplitude definition and varies from –80 mV to 20 mV over 200 ms as described in Mulroney and Myers. You can change the electrical excitation by editing the Amplitude feature named SA-NODE in Abaqus/CAE.
A user subroutine ( simulates the Atrioventricular node (AV) delay. A sensor monitors the nodal voltage on the right atrial side of the AV node. The nodal voltage on the ventricular side of the AV node is prescribed through a that retrieves the sensor value to monitor the AV delay. You can adjust the AV delay by changing the material constants associated with this amplitude definition.
The material constants that you can modify include:
- t_delay: The time duration between the atrial side of the AV node reaching a threshold voltage (EPOT_Act) and the activation of the ventricular side of the AV node. The default value is 85 ms.
- T2: The time duration between when the voltage of the ventricular side of AV node rises from the baseline voltage (Vi) to the peak voltage (Ve). The default value is 5 ms.
- Te: The time duration between when the voltage of the ventricular side of AV node drops from the peak voltage (Ve) back to the baseline voltage (Vi). The default value is 190 ms.
- Vi: Baseline voltage at AV node. The default value is -80 mV.
- Ve: Peak voltage at AV node. The default value is 20 mV.
- EPOT_Act: The threshold voltage on the atrial side of AV node. The default value is 10mV.
To change any of the default values listed above, you
can edit the
*Amplitude, definition=USER data line in the
Abaqus
input file.