Mechanical Analysis

The mechanical analysis contains multiple steps.

This page discusses:

Steps

The table below describes the steps in the mechanical analysis. For your convenience, Steps 2 and 3 (which together represent one complete cardiac cycle of one second duration) are defined. If you modify the model and/or introduce new components within the model, such as a device, you may need to activate these additional steps and run the model for several cycles to obtain a steady-state response.

Table 1. Steps in the Mechanical Analysis
Step Number Step Name Step Time Description
1 PRE-LOAD 0.3 s Achieve the approximate pre-stressed state of the heart at 70% diastole by linearly ramping up the pressure in the chambers.
2 BEAT1 0.5 s Atrial and ventricular contraction phase of cardiac cycle during which voltages from the electrical analysis (BEAT) are applied.
3 RECOVERY1 0.5 s Cardiac relaxation and ventricle filling phase.

The figure below shows the Wiggers diagram (by adh30 revised work by DanielChangMD who revised original work of DestinyQx; Redrawn as SVG by xavax - Wikimedia Commons: Wiggers Diagram.svg, CC BY-SA 4.0, https://commons.wikimedia.org/w/index.php?curid=50317988). The start point for each simulation of the cardiac cycle coincides with a P wave, and the simulation of the cardiac cycle ends at the next P wave.
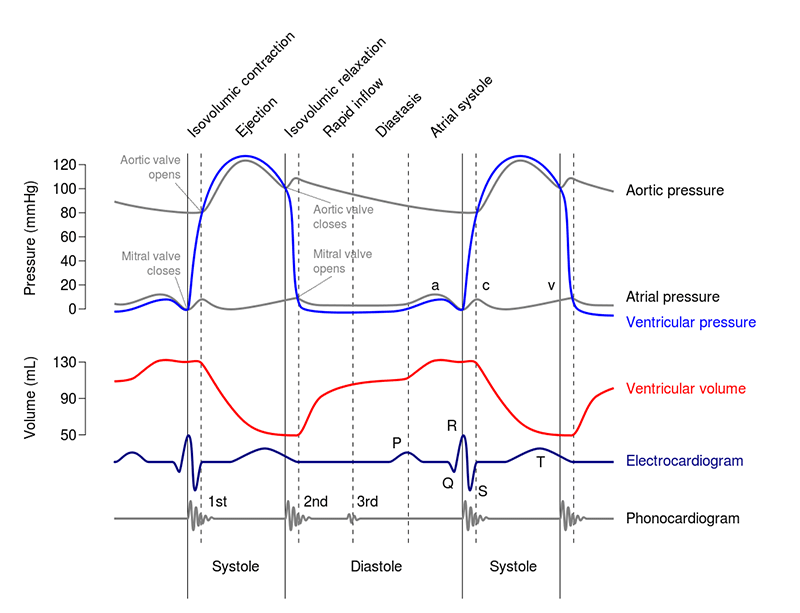
Wiggers Diagram

Contact Interactions

The Heart Model defines many contact surfaces and interactions, including a self-contacting surface on the endocardium and contact between valve leaflets. The contact surfaces and interactions are used to accurately model the interactions between the many different regions of the heart's anatomy.

Mass Scaling

Mass scaling (see “Mass Scaling” in the Abaqus Analysis Guide) is used throughout the mechanical analysis to reduce the run time. While there are many options for applying mass scaling, in this case, it is set to a value such that the stable time increment remains larger than 2.5e-6 seconds throughout the analysis. The total amount of added mass due to the mass scaling is 0.57% at the start of the analysis; however, this small amount of mass scaling substantially improves performance while having a negligible effect on the results.

Boundary Conditions Applied in All Steps

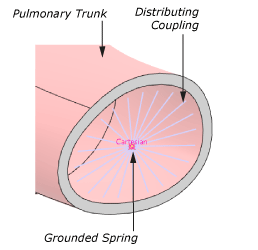
The heart is constrained via fixed boundary conditions (refer to feature BC_Ground) at the cut planes of the aortic arch, pulmonary trunk, and SVC. To represent the compliance of the external vasculature, the cut planes are allowed to move relative to fixed reference points by using a Distributing Coupling (see the figure below) with an elastic stiffness such that the maximum motion of the cut planes is less than a few millimeters during the cardiac cycle.

Boundary Conditions at the Cut Plane of the Pulmonary Trunk

The volumes of the cavities used to represent the arterial, venous, and pulmonary systems in the blood flow model are dependent on pressure. To account for this dependence, one of the six faces in each cavity is attached to a unidirectional spring while the remaining faces are fixed in all directions. Thus, the nodes comprising the faces attached to the springs are constrained to move in the X-direction only (refer to feature BC_Compliance_Axial), whereas the remaining cavity nodes are fully constrained (refer to feature BC_Compliance_Fixed).

Boundary Conditions in the PRE-LOAD Step

In the PRE-LOAD step, the pressures within the hydrostatic cavities are ramped up from zero to values cited to be normal at 70% diastole (see Normal Hemodynamic Parameters) as shown in the table below.

Table 2. Normal Pressures at 70% Diastole
Fluid Cavity Pressure
Fluid_Cavity_RA 0.0002666 MPa (2 mmHg)
Fluid_Cavity_LA 0.0005333 MPa (4 mmHg)
Fluid_Cavity_RV 0.0002666 MPa (2 mmHg)
Fluid_Cavity_LV 0.0005333 MPa (4 mmHg)
Fluid_Cavity_AA 0.01067 MPa (80 mmHg)
Fluid_Cavity_PT 0.001067 MPa (8 mmHg)
Fluid_Cavity_SVC 0.0002666 MPa (2 mmHg)
Fluid_Cavity_AC 0.010665 MPa (80 mmHg)
Fluid_Cavity_VC 0.0002666 MPa (2 mmHg)
Fluid_Cavity_PC 0.001067 MPa (8 mmHg)

Loads and Boundary Conditions in the Cardiac Cycle Steps (BEATn and RECOVERYn)

The pressure boundary conditions described above are removed in step BEAT1 and all subsequent steps, thus imposing a constant overall blood volume within the circulation system for the remainder of the analysis. The excitation (refer to feature Temp_BEATn-0n) applied to the model in every BEATn step is the electrical potential history from the electrical analysis. In every RECOVERYn step, the electrical potential of the entire heart is set to the resting potential (–80 mV). In addition, an electrical potential of –80 mV is applied to the aortic arch, pulmonary trunk, and SVC so that they display the appropriate passive response but do not respond actively.

Uniform distributed pressure loading is applied to each of the valve leaflets equal to the difference in pressure between:

  • The right and left atria and ventricles for the tricuspid and mitral valves, respectively
  • The right and left ventricle and the pulmonary and aortic cavities, respectively

The time history of the pressure observed in the arterial and venous cavities is applied as distributed pressure loads on the inside surfaces of the coronary and veins using fluid cavities defined for each of the four coronary branches included in the model.