-
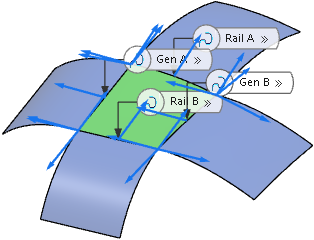
Create a blend surface, for example from four perpendicular curves.
-
In the boxes on the left column, select the entities for which the deviation shall be calculated, for a blend surface from four perpendicular curves these are Curve, Rail A, Rail B, Gen A, and Gen B.
-
In the G0, G1, G2, and G3 check boxes, select the continuities whose deviations you want to be displayed in the work area.
 In the Deviation section of the OmniSurf Perpendicular Curves panel, values of kept tolerances are displayed in green and tolerances not kept in red. -
In the Deviation section of the OmniSurf Perpendicular Curves panel, click
 . .
The deviation analyses method of the Connect Checker
 command is used. -
Clear all continuity and connection boxes and click
 . .
In the work area, the deviations not keeping the tolerance are displayed automatically.  This option always displays out-of-tolerance deviations in the work area, regardless of other selected options for displaying continuity and connection deviations. -
In the continuities list, select a continuity to display a series of numeric deviation values of the selected continuities.
-
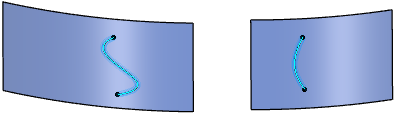
Open a 3D shape containing two surfaces with two projected curves.
-
Create a blend surface from the projected curves.
-
In the deviation section, clear all boxes except Curve and G0 and switch off .
Curve calculates the maximum G0 deviation of the result surface edge from the support curve. The support curve can be identical to the selected edges of support surfaces.
In the example, the G0 deviation of a result surface edge at Rail B from the projection support curve is outside the tolerance. 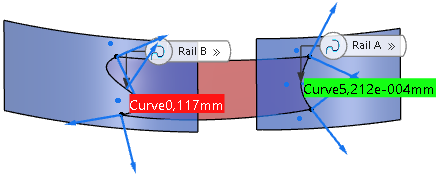
|