| Business Objects |
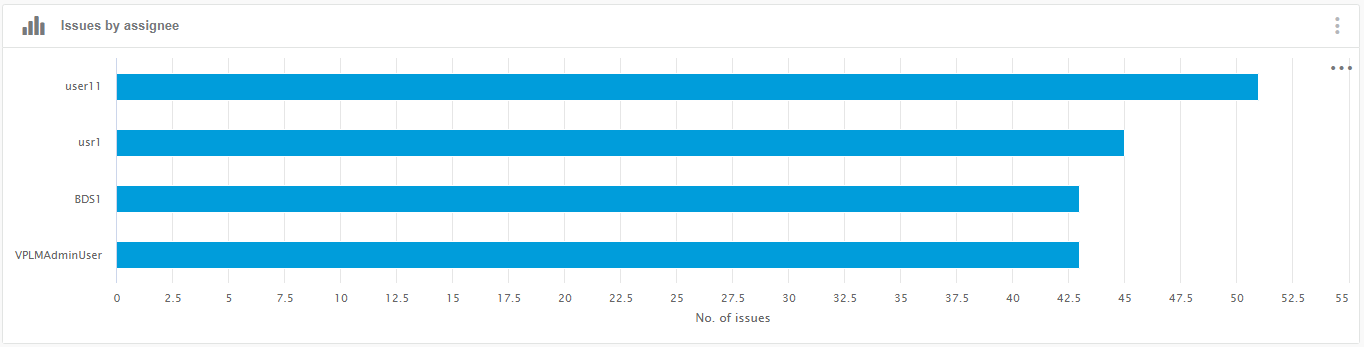
Issues (data model class issue) |
| Values (or X-Axis and Y-Axis) |
- X-Axis: Issue assignee.
- Y-Axis: Number of issues.
|
| Sorting |
The results are sorted by assignee count. |
| Limits |
Only 4 assignees are displayed. |
| Colors |
The color of this chart is blue. |
| Available Views |
Bar charts. |
| Interactions |
On this chart, you can:
- Click the bar names to filter on corresponding project.
- Click
 to get
all results and enable chart pagination. to get
all results and enable chart pagination.
- Click
 to
access the different options. to
access the different options.
- Click
 to add
annotations the cart. to add
annotations the cart.
- Click
 to
modify the chart cfiguration. to
modify the chart cfiguration.
- Click
 to create
an alert. to create
an alert.
- Click
 to see
chart documentation. to see
chart documentation.
- Click
 to
switch to fullscreen display. to
switch to fullscreen display.
- Click
 to switch
to table display. to switch
to table display.
|
| Technical Details |
- Data model
- Class:
issue
- Property:
to_assigned_issue
- Mashup feed
(issues)
- Aggregations on facet issue_to_assigned_issue:
count
|