| Business Objects |
Issues (data model class issue) |
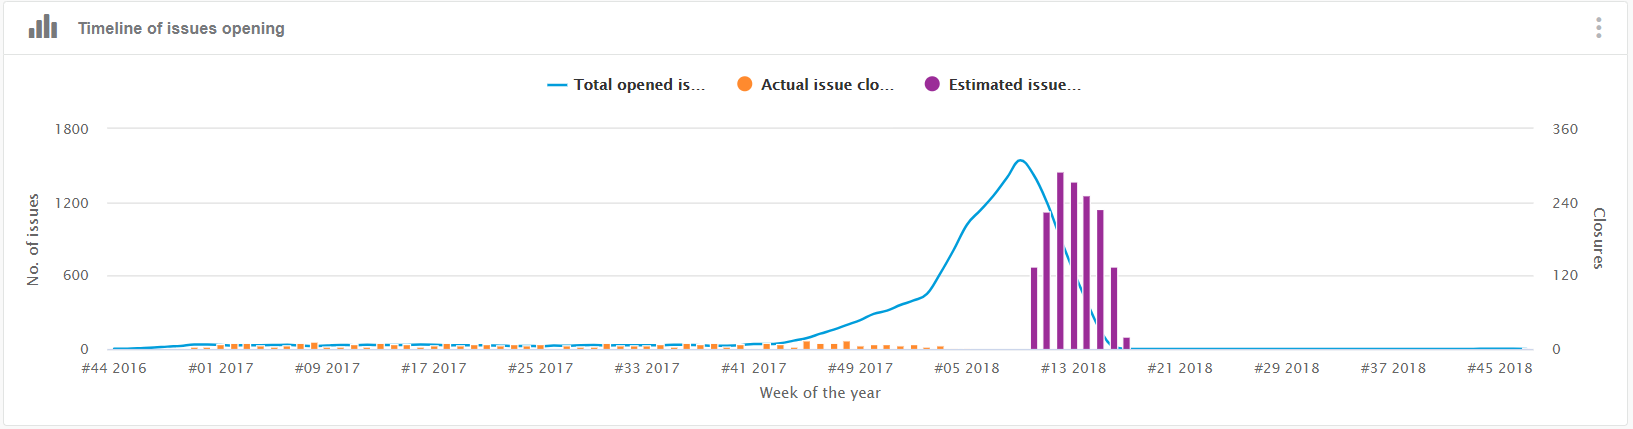
| Values (or X-Axis and Y-Axis) |
- X-Axis: Week of the year.
- Y-Axis: Number of issues.
|
| Sorting |
The results are sorted by week of the year. |
| Limits |
There are no limits. |
| Colors |
- The number of opened issues is blue.
- The number of issues that are closed is orange.
- The number of issues that are expected to be closed is purple.
|
| Available Views |
Bar chart and line chart. |
| Interactions |
On this chart, you can:
- Click
 to
access the different options. to
access the different options.
- Click
 to add
annotations the cart. to add
annotations the cart.
- Click
 to
modify the chart configuration. to
modify the chart configuration.
- Click
 to create
an alert. to create
an alert.
- Click
 to see
chart documentation. to see
chart documentation.
- Click
 to
switch to fullscreen display. to
switch to fullscreen display.
- Click
 to switch
to table display. to switch
to table display.
|
| Technical Details |
- Mashup feed (issues)
- Facet
closure_state
- aggregation
totalopen: open_state.opened -
closure_state.closed
- Facet
closuredatedyn
- Facet
closureestimateddate
|