Issue Detection Time of by Part Assembly

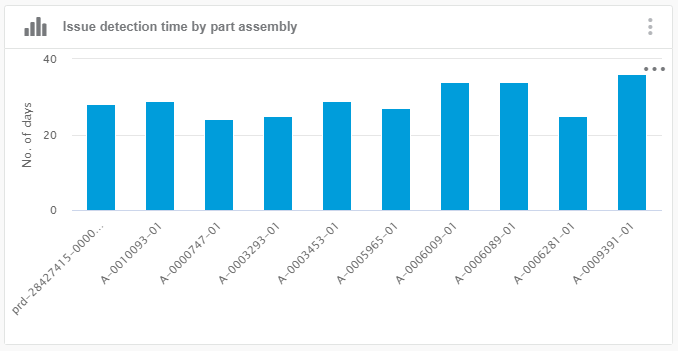
This chart shows the issue detection time by part assembly.

Business Objects Issues (data model class issue)
Values (or X-Axis and Y-Axis)
  • X-Axis: Assembly.
  • Y-Axis: Number of days.
Sorting The results are sorted by assembly count.
Limits By default, only the top 10 categories are displayed.
Note: You can change the pagination to display all the categories by clicking .
Colors Colors are assigned by priority and can be configured in Preferences. For more information, see Configuring Facet Displays.
Available Views Bar chart.
Interactions On this chart, you can:
  • Click the bar names to filter on corresponding project.
  • Click to get all results and enable chart pagination.
  • Click to access the different options.
  • Click to add annotations the cart.
  • Click to modify the chart configuration.
  • Click to create an alert.
  • Click to see chart documentation.
  • Click to switch to fullscreen display.
  • Click to switch to table display.
Technical Details
  • Data model
  • Class: issue
  • Property: relatedpartspath
  • Mashup feed (issuesclosed)
    • Aggregation on facet issue_relatedpartspath: dateDiff (AVG(#ndays(#extract(document_state_start,'state_start_create'),issue_actual_start_date)))