History of Issues by State | ||
| ||
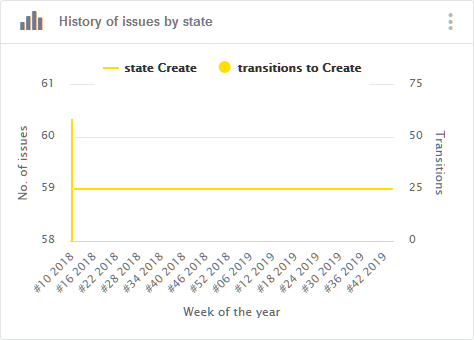
| Business Objects | Issues (data model class issue), that are
historized.Note:
Instead of
current, the
history_type is snapshot or
transition. |
| Values (or X-Axis and Y-Axis) |
|
| Sorting | The results are chronologically sorted, from the oldest to the most recent. |
| Limits | There are no limits. |
| Colors | Colors are based on the mapping for the current facet. Colors are configured in Preferences. For more information, see Configuring Facet Displays. |
| Available Views | Indicator values with history. |
| Interactions | On this chart, you can:
|
| Technical Details |
|
 to
access the different options.
to
access the different options. to add
annotations the cart.
to add
annotations the cart. to
modify the chart configuration.
to
modify the chart configuration. to create
an alert.
to create
an alert. to see
chart documentation.
to see
chart documentation. to
switch to fullscreen display.
to
switch to fullscreen display.