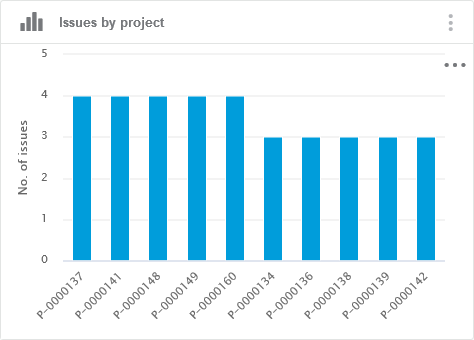
Issues by Project, Type, State, Age, Organization, Priority

This set of charts displays the number of issues broken down by a specific dimension: project, problem type, state, age, organization, or priority. These charts have identical configurations for display and interactions, but on different facets.

This page discusses:

Issues by Project

This chart shows the total number of issues by project.

Business Objects Issues (data model class issue)
Values (or X-Axis and Y-Axis)
  • X-Axis: Project names.
  • Y-Axis: Number of issues in each project.
Sorting The results are sorted by category count, descending.
Limits By default, only the top 10 categories are displayed.
Note: You can change the pagination to display all the categories by clicking the menu .
Colors Colors are configured in Preferences. For more information, see Configuring Facet Displays.
Available Views
  • Bar chart
  • Full screen view
  • Table view
Interactions On this chart, you can:
  • Click the bar names to filter on corresponding project.
  • Click to get all results and enable chart pagination.
  • Click to access the different options.
  • Click to add annotations the cart.
  • Click to modify the chart configuration.
  • Click to create an alert.
  • Click to see chart documentation.
  • Click to switch to fullscreen display.
  • Click to switch to table display.
Technical Details
  • Data model
  • Class: issue
    • Inherited from document
      • Property: related_project
  • Mashup feed (issues).

Issues by Type

This chart displays the total number of issues by problem type.

Business Objects Issues (data model class issue)
Values (or X-Axis and Y-Axis)
  • X-Axis: Problem types.
  • Y-Axis: Number of issues in each category.
Sorting The results are sorted by category count, descending.
Limits By default, only the top 10 categories are displayed.
Note: You can change the pagination to display all the categories by clicking the menu .
Colors Colors are configured in Preferences. For more information, see Configuring Facet Displays.
Available Views
  • Bar chart
  • Full screen view
  • Table view
Interactions On this chart, you can:
  • Click the bar names to filter on corresponding project.
  • Click to get all results and enable chart pagination.
  • Click to access the different options.
  • Click to add annotations the cart.
  • Click to modify the chart configuration.
  • Click to create an alert.
  • Click to see chart documentation.
  • Click to switch to fullscreen display.
  • Click to switch to table display.
Technical Details
  • Data model
  • Class: issue
    • Property: problem_type
  • Mashup feed (issues).

Issues by State

This chart shows the total number of issues by current state.

Business objects Issues (data model class issue)
Values (or X-Axis and Y-Axis)
  • X-Axis: Facet categories.
  • Y-Axis: Number of issues in each category.
Sorting The results are explicitly sorted.
Limits By default, only the top 10 categories are displayed.
Note: You can change the pagination to display all the categories by clicking the menu .
Colors Colors can be configured in Preferences. For more information, see Configuring Facet Displays.
Available views
  • Bar chart
  • Full screen view
  • Table view
Interactions On this chart, you can:
  • Click the bar names to filter on corresponding project.
  • Click to get all results and enable chart pagination.
  • Click to access the different options.
  • Click to add annotations the cart.
  • Click to modify the chart configuration.
  • Click to create an alert.
  • Click to see chart documentation.
  • Click to switch to fullscreen display.
  • Click to switch to table display.
Technical Details
  • Data model
  • Class: issue
    • Inherited from document
      • Property: current
  • Mashup feed (issues)

Issues by Age

This chart shows the total number of issues by age, which corresponds to the time they have been open.

Business Objects Issues (data model class issue)
Values (or X-Axis and Y-Axis)
  • X-Axis: Age intervals, defined in the applicative configuration.
  • Y-Axis: Number of issues in each category.
Sorting The results are explicitly sorted.
Limits Only defined intervals are displayed.
Colors There is no color setting.
Available Views
  • Bar chart
  • Full screen view
  • Table view
Interactions On this chart, you can:
  • Click the bar names to filter on corresponding project.
  • Click to get all results and enable chart pagination.
  • Click to access the different options.
  • Click to add annotations the cart.
  • Click to modify the chart configuration.
  • Click to create an alert.
  • Click to see chart documentation.
  • Click to switch to fullscreen display.
  • Click to switch to table display.
Technical Details
  • Data model
  • Class: issue
    • Property: actual_start_date
    • Property: actual_end_date
  • Mashup feed (issues)
    • Virtual field num_closure_days: #ndays(issue_actual_start_date,issue_actual_end_date)
    • Trigger CreateDynamicdateRangeFacetTrigger to create the closure_days_custom (and closure_days_custom_refine) facets:
      • Expression: num_closure_days
      • Ranges: defined in the applicative configuration

Issues by Organization

This chart shows the total number of issues by reporting organization.

Business Objects Issues (data model class issue)
Values (or X-Axis and Y-Axis)
  • X-Axis: Facet categories.
  • Y-Axis: Number of issues in each category.
Sorting The results are sorted by category count, descending.
Limits By default, only the top 10 categories are displayed.
Note: You can change the pagination to display all the categories by clicking the menu .
Colors Colors are associated to facet categories and are configured in Preferences. For more information, see Configuring Facet Displays.
Available Views
  • Bar chart
  • Full screen
  • Table view
Interactions On this chart, you can:
  • Click the bar names to filter on corresponding project.
  • Click to get all results and enable chart pagination.
  • Click to access the different options.
  • Click to add annotations the cart.
  • Click to modify the chart configuration.
  • Click to create an alert.
  • Click to see chart documentation.
  • Click to switch to fullscreen display.
  • Click to switch to table display.
Technical Details
  • Data model
  • Class: issue
    • Property: to_reporting_organization
  • Mashup feed (issues)

Issues by Priority

This chart shows the total number of issues by priority.

Business Objects Issues (data model class issue)
Values (or X-Axis and Y-Axis)
  • X-Axis: Facet categories.
  • Y-Axis: Number of issues in each category.
Sorting The results are explicitly sorted.
Limits There are no limits.
Colors Colors are associated to facet categories and are configured in Preferences. For more information, see Configuring Facet Displays.
Available Views
  • Bar chart
  • Full screen view
  • Table view
Interactions On this chart, you can:
  • Click the bar names to filter on corresponding project.
  • Click to get all results and enable chart pagination.
  • Click to access the different options.
  • Click to add annotations the cart.
  • Click to modify the chart configuration.
  • Click to create an alert.
  • Click to see chart documentation.
  • Click to switch to fullscreen display.
  • Click to switch to table display.
Technical Details
  • Data model
  • Class: issue
    • Property: priority
  • Mashup feed (issues)