Understanding Session Crash Reporting

This section describes session crash reporting processes and tools designed to implement failure management.

This page discusses:

Overview

This overview highlights the main features of the session crash reporting mechanism. The session crash reporting process on Windows comprises two mechanisms.

A separate process, referred to as the Incident Report Manager, is used to generate a crash report. This process:

  • sits idle until the process it is watching signals that a crash has occurred
  • avoids run-time overheads during memory corruption of the monitored application
  • makes an effective snapshot of the whole application
  • and is responsible of the significant task of the crash dump reporting.

The second component is the improvement of call stack walking using a symbol server:

  • it is based on a PDB database designed to retrieve automatically and rapidly correct symbols without any product names or release or build number information
  • it is easy to handle thanks to Microsoft Debug Tools (DbgHelp.dll)
  • access is via shared directories (and possible HTTP or HTTPS).

So the crash mechanism provides the following benefits:

  • it raises "systematically" correct stack information (modules, symbols, source code references, etc...)
  • it ensures safer just-in-time process failure monitoring
  • it provides a non-intrusive process
  • it ensures simplest backward compatibility.

Furthermore, the Incident Report Manager generates a more complete and versatile set of session crash (incident) reports in a compressed file, in addition to the historical session and abend trace files. This file will be generated on the client site and post-analyzed on the Dassault Systèmes site.

How do the Different Mechanisms Work?

This section contains illustrations describing how the different mechanisms work.

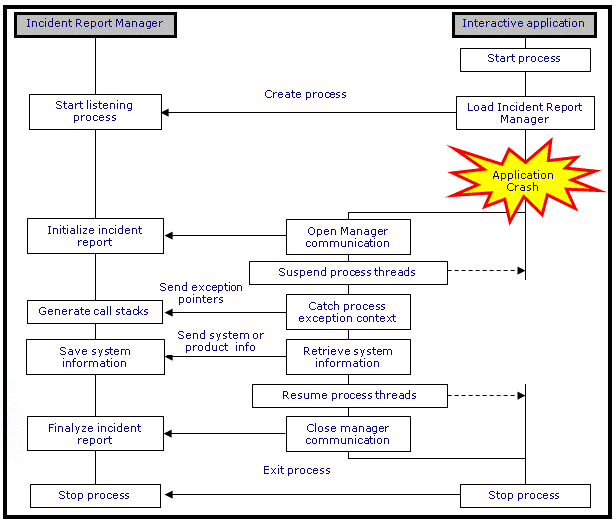
The following diagram illustrates the process-level view of how incident reports are generated:

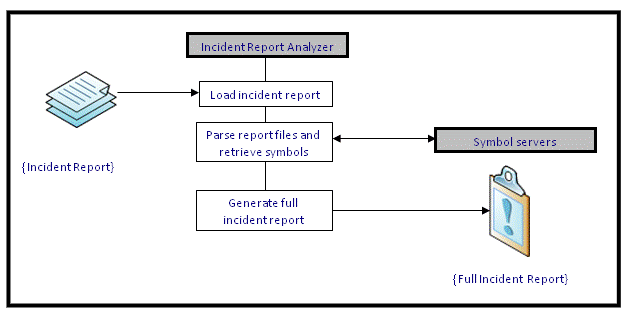
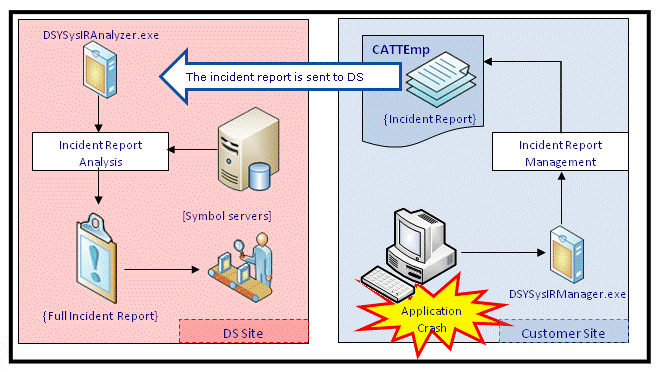
The following diagram illustrates the process-level view of how incident reports are analyzed:

A Closer Look at the Crash Management Process

This section provides a closer look at how the whole crash management process is implemented.

The process comprises two steps:

  1. a raw incident report is first generated in a compressed format. This file contains the necessary data needed to perform complete analysis during the post-process stage.
  2. then, the real context of the software failure is analyzed and determined. This analysis will always be done on the Dassault Systèmes site.

The whole process is illustrated below:

Crash Report Management And Files Generated

This section explains crash report management and files generated.

When a crash occurs, a just-in-time incident report is generated. It is a collection of compressed files (in ZIP format) containing the data required to generate the final incident report, and providing the most accurate view possible of what happened.

The file naming convention is as follows:

[ApplicationName]_IR[Architecture]_D[Year]_[Month]_[Day]_[Hour]_[Minute]_[Second].zip

Windows minidump file in user-mode (.dmp)

This section explains Window mini-dump files.

This file contains enough information to perform basic debugging operations by still keeping the minidump size as small as possible. Current versions of Microsoft Office and Microsoft Windows create these minidump files for the purpose of analyzing failures on customers' computers.

The current configuration options used to generate this dump are:

MINIDUMP_TYPE flags MiniDumpNormal, MiniDumpWithIndirectlyReferencedMemory, MiniDumpScanMemory
MiniDumpCallbackIncludeThreadCallback, IncludeModuleCallback, ThreadCallback, ModuleCallback

The MINIDUMP_TYPE enumeration is a set of flags that provides control over the contents of the minidump. We use this combination to debug more complex problems than a simple access violation or a deadlock. Here is a description of the flags used:

MiniDumpNormal

This flag represents the basic set of data that is always present in minidump. Here are the kind of data belongs to this set:

  • Information about the operating system and CPU, including: operating system version (including service pack), number of processors and their model
  • Information about the process, including: process ID, process times (creation time, and the time spent executing user and kernel code)
  • For every executable module loaded by the process, the following information is included: load address, size of the module, file name (including path), version information (VS_FIXEDFILEINFO structure), module identity information that helps debuggers to locate the matching module and load debug information for it (checksum, timestamp, debug information record)
  • For every thread running in the process, the following information is included: thread ID, priority, thread content, suspend count
  • Address of the thread environment block (TEB) (but the contents of TEB are not included)
  • For every thread, the contents of its stack memory are included into the minidump. It allows us to obtain call stacks of the threads, inspect the values of function parameters and local variables.
  • For every thread, 256 bytes of memory around the current instruction pointer are stored. It allows us to see the disassembly of the code the thread was executing at the moment of failure, even if the executable module itself is not available on the developer's machine.
  • Exception information can be included into the minidump via the fifth parameter of the MiniDumpWriteDump function: Exception record (EXCEPTION_RECORD structure, thread context at the moment of the exception, Instruction window (256 bytes of memory around the address of the instruction that raised the exception).
MiniDumpScanMemory
This flag allows us to save space in the minidump by excluding executable modules that are not needed to debug the problem. The flag works in close cooperation with MiniDumpCallback function.
MiniDumpWithIndirectlyReferencedMemory

With this flag specified, the MiniDumpWriteDump function will scan the stack memory of every thread looking for pointers that point to other readable memory pages in the process' address space. For every pointer found, 1024 bytes of memory around the location it points to will be stored in the minidump (256 bytes before and 768 bytes after).

The MiniDumpCallback function is used to customize the contents of our minidump beyond MINIDUMP_TYPE flags. This is a user-defined callback, which is called byMiniDumpWriteDump to get decision on whether to include/exclude some data into the minidump. In our configuration, we use:

  • IncludeThreadCallback: include all threads
  • IncludeModuleCallback: include all modules
  • ThreadCallback: include all threads
  • ModuleCallback

    Check ModuleWriteFlags and exclude all modules whose ModuleReferencedByMemory flag is not set.

Even with this configuration, we may not be able to see the values of global variables, and cannot inspect the data allocated on the heap and in TLS (unless it is referenced from the thread stacks).

More information about minidump can be found in the official Microsoft documentation.
Just-in-time system information data file (.irp)

This section describes the .irp file.

This is an intermediate text file used for the final analysis. It contains system and product information, which can be helpful to identify the problem with a increased accuracy. This file is not supposed to be read or accessed directly.

Historical abend information file

This section describes the historical abend info file.

In certain situations, the historical session information file AbendTrace_xxx.txt file could be saved in the compressed file collection.

Compressed file version (.vrs)

This is an empty file which references the version of the debug material archive.

Crash Report Analysis and the Full Incident Report

This section describes the rash report analysis and full incident report.

The full incident report is an XML file containing information about the user session at crash time. It comprises the following sections:

Product information
Product information comprises:
  • process name
  • level and release
Session information
Session information comprises:
  • user name
  • machine name
  • session duration.
Machine information
Machine information comprises:
  • model, manufacturer
  • operating system version, language
  • architecture
  • Visual driver information
Process information
Process information comprises:
  • command line arguments
  • environment variables
  • process information (modules and threads)
  • last user interactions
Incident details
Incident details are:
  • exception information
  • call stacks