Click
OK in the
Configure Knowledge Monitor dialog box. Click
Open Knowledge Monitor. The
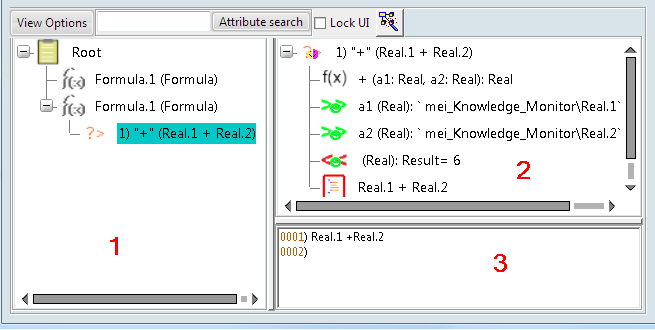
Knowledge Monitor window opens. It is divided into
three boxes.
Note:
You an access the knowledge browser from the Knowledge Monitor.
It can provide you with additional information related to the objects you trace
in the monitor provided these objects are still in session.
Time Line
The timeline (1) shows the complete trace at debug. Execution units
are shown in a
tree-like
structure under a root node which is a virtual node independent from execution
units.

The timeline indicates errors using an icon
 layered on top of the timeline icons.

This icon can be followed down in the
tree
until reaching the last error icon, which indicates the execution unit
generating the error.
Unit Profile Area
Double-clicking a node in the timeline opens the
Unit Profile Area (2).
Note:
the unit profile area presentation may differ depending on the
type of the execution unit you want to trace.
- Attributes
- An attribute is a single-value parameter, variable, or a
logical grouping of variables (such as a list or an object). For simple
attributes, the corresponding information appears in a single line. For complex
attributes, the subvalues are displayed in individual lines under the
containing parent. If a complex attribute (such as a list) has a single value,
no value appears under the attribute. The value information appears in the same
line as the attribute.
The Input/Output type (IN/OUT or NEUTRAL) of an attribute is
identified by a generic icon and/or by a specific symbol when a specific icon
is registered for the attribute.
-
 : Generic input attribute.
-
 : Input attribute symbol.
-
 : Generic icon for neutral attributes.
-
 : Neutral attribute symbol.
-
 : Generic icon for output attributes.
-
 : Output attribute symbol.
Some attribute values can have connections to objects in session.
Such attributes are flagged using
 or
or
 and enable more advanced user interactions:
- Selecting the attribute or its value highlights any
representation of the object in the
3D area.
- Right-clicking an attribute and selecting
Search references enables you to track all
references of the object (based on its address) throughout the timeline, or to
track the changes made to the attribute.
Notes:
- The result of the above operations appears in the
Versatile View (3).
-
 indicates that an attribute was modified. The attribute
currently selected in the
Unit Profile Area is designated using
 .
.
- Messages
-
A message is a character string that conveys additional
information about the execution. Messages can describe error conditions or
detail an execution context. As stated previously, the execution unit profile
can display additional information based on the category of the unit.

- Signature
- Available for EKL expressions for example, shows the
method/operator signature being executed. A signature contains the name of the
method/operator, the list of arguments, and the return type. The signature is
identified by
f(x).
- Body
- The body of an execution unit is the code being executed in the
unit. For EKL expressions or Knowledge
relations, this is
mostly EKL code.
Versatile View
The
Versatile View (3) enables you to:
- Display results of interactions with the execution unit profile
(track changes or references for example).
- Display the code for EKL expressions or Knowledge relations.
- Double-click the item in the profile to show the same text in the
Versatile view.
- Display results of text-based attribute search. Text-based
searches help locate attributes based on their names or parts of their names.

- Cross-Referencing and Highlighting
-
Double-clicking an item in the
Versatile View filters the timeline to
display the nodes that affect the attribute value. Select one of the
Timeline Filtering options to check how
this behavior can be controlled.
Note:
Double-clicking an EKL node in the timeline opens its
parent Knowledge relation profile in the profile view and the body in the
Versatile View, while highlighting the
code lines related to the EKL node.

 layered on top of the timeline icons.

 : Generic input attribute.
 : Input attribute symbol.
 : Generic icon for neutral attributes.
 : Neutral attribute symbol.
 : Generic icon for output attributes.
 : Output attribute symbol.
 or
or
 and enable more advanced user interactions:
 indicates that an attribute was modified. The attribute
currently selected in the
 .
.

