About the Knowledgeware Debugger | ||
| ||
The following objects can be debugged:
-
Rules
- Actions
- Knowledge Patterns
- PLM Rules
- PLM Checks
- Know-how Apps Logic Rules
- Knowledge Language Operations
- Business rules
- Know-how library functions.
- Interface
-
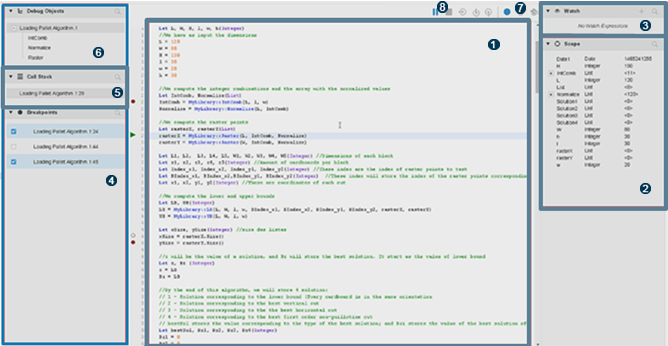

Code shows the code being debugged. It provides basic syntax coloring, line numbers, ability to insert and remove breakpoints, brace and bracket matching, current line highlighting and current line marker. 
scope contains the parameters manipulated in the current code. Some parameters (the literal ones) can be edited in this view. If the change is successful, the new value appears in the field after validation. 
Watch contains the parameters the user wants to store and be visible during the debugging session. 
Breakpoints shows the breakpoints added to a business rule. 
Stack: some EKL entities can call other EKL code (for example a rule can call an action). The chaining of these calls is shown in the Stack view. Clicking an object shows its code in the Code view as well as the registered breakpoints. 
Debuggable Objects shows a list of the entities entered as debuggable. The entity and the associated code are available to the Knowledgeware debugger before they start executing, allowing you to investigate your code and insert breakpoints. 
- Messages shows messages generated during the execution and targeted at the Knowledge Monitor (these are mostly warnings or error messages).
- Add Breakpoint lets you add breakpoints to a business rule.
- Activate/Deactivate breakpoints activates or deactivates simultaneously all breakpoints.

The Knowledgeware debugger provides five commands that let you interact with the EKL script: - Continue resumes the code execution.
- Step Into moves to a reusable function or a called action for example.
- Step Out completes the current code entity, breaks, and goes back to the caller code.
- Step Over executes the next line even if it includes multiple instructions.
- Break interrupts the execution at the current line.
- Stop Execution stops the execution of the script.
- Considerations
- You should take the following considerations into account:
- Attach the Knowledgeware debugger before you launch the EKL code execution so as to provide all information to the Knowledgeware debugger. If you attach the Knowledgeware debugger after the start of the EKL execution, some information such as full stack or parameters information may not be available.
- Data breakpoints (breaking on parameter value change) are not supported.
- In Know-how Apps Logic concepts, it is impossible to debug external rules used as functions. It is possible to debug external rules when called as such.