About Model Plots Mode | |
| |
The first time Model Plots mode is activated in a model, a Visualization folder is created in the tree under the FEM representation. This folder contains two subfolders, one for Plots and another for Named Groups. The Plots folder contains an undeformed plot that you can also visualize in the work area. If you activate this mode for a model already containing one or more plots, the last activated plot is displayed. The Named Groups folder contains the default display group.
Plotting Tools
Model Plots mode allows you to create contour, symbol, color code, and ply stack plots to analyze your preprocessing data before you solve the simulation. You can use this approach to verify attributes of the model and check for errors without the need for a lengthy performance intensive solve. Typically, you would activate Model Plots mode after you are done making changes in a model or scenario app to test the outcome. Some of the attributes you can verify include section assignments, section thickness and offset, element types, ply stacks, and ply orientations.
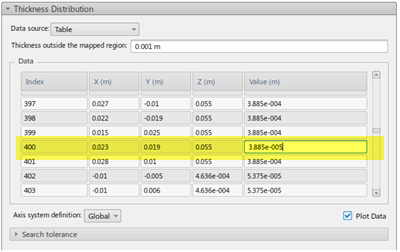
The following example illustrates how Model Plots mode can be helpful. The imported shell thickness data for a plastic bottle is shown below, followed by the resulting contour plot created in Model Plots mode.

The thickness value highlighted above is off by a factor of 10, resulting in an unexpected displacement contour plot in that area. In the image below, the bottle on the left bears a hotspot at this location. Catching the error in Model Plots mode (rather than in Physics Results Explorer) saves you time. You can now make the correction before you solve the simulation. In the image below, the bottle on the right has the correct value. The blue region is thinner in the displacement plot, as intended.

Display Groups
You can use display groups to explore your models further. Display groups are discrete areas of the model you can filter from your view. You can create display groups based on several criteria such as parts, entities, groups, values, labels, sets, and types. In addition, you can provide custom names for any display groups, facilitating re-use rather than creating them new each time.
Field Data and Experience Content
You can export field data in a .csv file for later analysis in programs such as Microsoft Excel. In Model Plots mode, the exported file is saved to the disk.
Model Plots mode also allows you to create a lightweight set of data for use in the 3DPlay and Physics Simulation Review apps. This experience content can include a default set of model, scenario, and results data for native simulations. You can customize this default set of experience content in the Experience Content dialog box to select the specific data to generate.