Balancing Operations on Working and Nonworking Resources | ||
| ||
-
From the Authoring section of the action bar, click Resource Balancing
 .
.
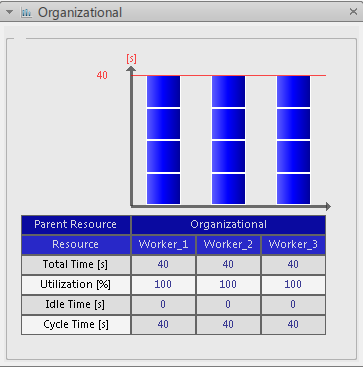
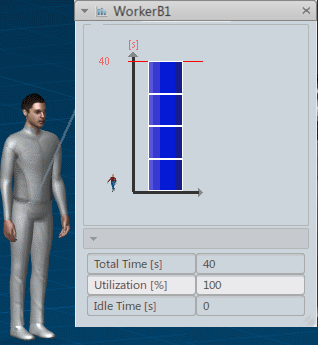
The Resource Balancing panel displays. This is the global panel showing the operations assigned to all the working resources under the selected organizational resource.
The colored rectangles in the bar chart show the operations assigned to each resource. By default, the operations are represented by blue rectangles. Parallel operations (that is, operations that are done at the same time on a given resource) are represented by red rectangles.
Tip: You can customize this color in Me  > Preferences > App Preferences > Simulation > Process Engineering
.
> Preferences > App Preferences > Simulation > Process Engineering
. -
From the Authoring section of the action bar, click Resource Utilization Gantt
 .
The Gantt chart shows that some of the operations are sequenced, others are not.
.
The Gantt chart shows that some of the operations are sequenced, others are not. -
Drag an Unloading operation from WorkerA to WorkerB.
The operation is added to WorkerB.
-
Sequence the operations in the Gantt chart.
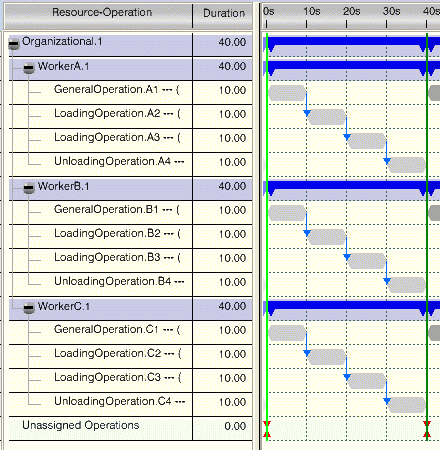
The bar chart and the information in the table are updated accordingly (total time, utilization, and so on).