About Results Comparisons | |
| |
You can uniquely configure up to eight views. You can then populate the configured views with plots of your choice and save the configured views as a template for future use.
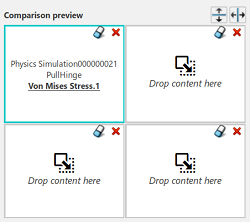
By default, four views are displayed:
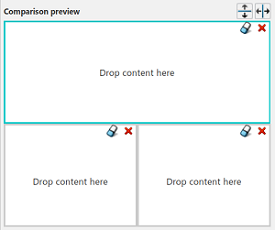
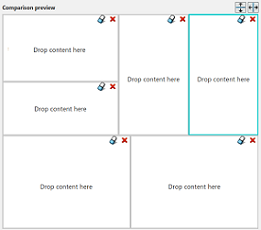
However, you can create
multiple view arrangements by merging or splitting rows either horizontally  or
vertically
  :
:


After you decide on a view configuration, you can select plots to display for each view. From the left side of the Compare Results panel, you can select plots of interest from analysis cases in your session and drag them into the Comparison preview panel.
Once you commit the changes to the view configuration, the selected plots appear in the 3D area and the Compare Results Options dialog box appears. The Compare Results Options dialog box allows you to save the configuration, modify the synchronization options, or return to the Comparison preview to edit the configuration.
In the example below, two different field plots (von Mises stress and velocity)
are displayed for two different models. One model comparison displays two plots one above the
other with a horizontal separation between them. The other comparison places the plots side by
side with a vertical separation between them. One large view at the bottom displays an X-Y
plot displaying two curves. 
This X-Y plot
was created by dragging two distinct X-Y plots into the same view. It is a convenient way to
demonstrate the inverse relationship between kinetic energy and total strain energy.
The behavior of plots in multiple views depends on which view is active and which analysis case you display. A comparison view becomes the active view when you click within its boundaries. The robot appears in the lower right corner of the active view. Within the active view, you can change the plot displayed or select one of its attributes (step, frame, or load case). The changes you make in the active view are applied to all views if the Steps and frames synchronization option is selected. Otherwise, your changes are applied to the active view only.
Using Templates
You can use templates to compare similar plots across analysis cases and simulation objects in your session. You can automatically configure your view with similar plots to an initial plot you have open. For example, if you have a von Mises plot open, you can use a template to find other von Mises plots in all analysis cases within the simulation. You can create the comparison view by creating new sections or deleting extraneous views.
When you apply a template across simulations, Physics Results Explorer finds all plots of the same analysis cases from all simulations in your session and creates the comparison view by creating new sections or deleting extraneous views.
Manipulation and Synchronization of Plot Views
You can synchronize view manipulations of plots (such as pan, rotate, and zoom) across all views. When you enable synchronization, you can also apply the orientation and zoom of the current plot view to all other views. You can also synchronize each view to display data for the same steps and frames.
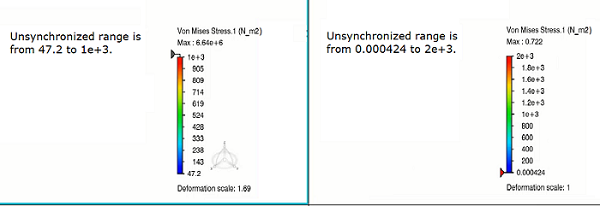
You can also synchronize the legends to display the same data range. This is convenient
when you want to examine results values between two or more plots over the same scale. In
the following example, the data ranges differ for two von Mises plots. 
The upper and lower bounds of the two von Mises plots in the comparison view have
different values.
When you enable
legend synchronization, the legends adjust to accommodate the entire range. The same upper
and lower bounds are now used for all legends. 
If any of the
legends has a user-specified minimum or maximum value, this upper or lower limit is
indicated with underlined text. This is a helpful indicator when you want to reset the user
applied value.
Saving and Editing Plot Views
You can save the configuration of plots and views for later reference. By default, the configuration is first saved with the name Comparison.1. You can edit this configuration name in the Save Comparison dialog box. If you make changes to the configuration and save again, the changes are saved to the original named configuration. However, if you select Save As, the changes are saved as a new comparison, Comparison.2. Save overwrites the current configuration, whereas Save As saves the configuration with a new name.
When you select Edit
![]() , the
Edit Comparison panel appears. This panel is identical to
the Compare Results panel, differing in name only. You can make
changes to the configuration of views and the plots referenced in each view. Specifically,
you can clear the contents of the view, delete the view, or split the view horizontally or
vertically.
, the
Edit Comparison panel appears. This panel is identical to
the Compare Results panel, differing in name only. You can make
changes to the configuration of views and the plots referenced in each view. Specifically,
you can clear the contents of the view, delete the view, or split the view horizontally or
vertically.
When you activate a saved comparison, the saved configuration displays. If a simulation is no longer open in your session, Physics Results Explorer issues a warning, as shown below.

The warning message provides the information that you need to open the missing plots for the comparison view.