The report consists of interference results that are displayed in the
interference simulation multi-list.
The report is an HTML or CSV file based that consists of the summary and details of
the interference computation result. You can specify the required format under
Report format available in Me > Preferences > App Preferences > Social and Collaborative > Global Design Management > Interference Check > Report Generation expander.
An interference report is generated based on the date and time. Generating a new
report does not overwrite the previous one. An HTML report displays the following
information:
A table indicating the following modes:
Selection Mode: Indicates the mode selected to
define the context for which the interference is computed, such as
Between all Components, Inside
Groups, Group against Group, and
Group against Context.
Computation Mode: Indicates the specifications
selected in the Specifications tab based on which
the interference is calculated. See Create an Interference Simulation.
Clearance distance: Indicates the minimum
clearance value specified while computing the interference. This column
appears when the Clearance check box is selected.
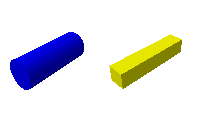
A table indicating the product selected for the computation.
An image of the product.
Note:
If you generate the report when the simulation
is in the explore mode, this image is not displayed.
Two 3D pie charts, Analysis status, and
Solver status, with legends that provide a summary of
the total interferences.
A table displaying the following information of the simulation results of the
interferences:
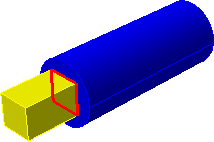
An image of the instances involved in the interference
Two columns for the names of the instances
Columns that provide validity status, system status, quantifier, update
status, and description for the respective interferences. For more
information, see Attribute Columns.
When you click any of the rows, the interference details open in a new
browser window for the respective instances, which additionally display the
following:
A table of the detailed interference result, with the following
additional columns:
Definition: Provides the metric name
of the instance
Contextual Interference Name
Specification: Provides the
specifications selected for interference computation
Columns that provide user status, analysis status, and
previous status for the instances
An image of the instances with interference curves
Note:
When you
generate the report in the explore mode, the instances under the
context for which the interference is computed, appears
separately in this table without interference curves. For more
information, see Publish a Report for the Simulation in Explore Mode.
Instances with Interference Curves
Instances without Interference
Curves
Legends that indicate the names of the instances between which the
interference is computed.
When you generate the report in CSV format, while generating the report, all the
columns available in the interference simulation multi-list are exported to the
excel sheet. You can also use Export Filtered and
Export Selected to generate the report of required
interference instances.
Location of the Report
The report and the directory containing support files are saved on the local drive at
the specified location. By default, the report directory is created in the CATTemp
directory as GraphSVG.
You can specify the required location to save the report. To do so, Click
Report Directory under Report
(available at Me > Preferences > App Preferences > Social and Collaborative > Global Design Management > Interference Check > Report Generation expander) and specify the required location.
The directory contains the following support files:
An index.xml file that gathers all textual information
about interferences
A dtd file and an XSL file that contains presentation information