| Business Objects |
Project (data model class "gate") |
| Values (or X-Axis and Y-Axis) |
- X-Axis: timeline (week unit), based on
history_weekofyear
facet.
- Value and Y-Axis of timeline: aggregation value corresponding respectively to
SUM of
- Gates held on time (start):
snapshot documents
(document_history_type field) with a negative number of
days between project_actual_start_date and
project_estimated_start_date.
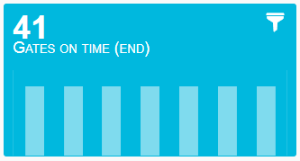
- Gates on time (end):
snapshot documents
(document_history_type field) with a negative number of
days between project_actual_end_date and project_estimated_end_date.
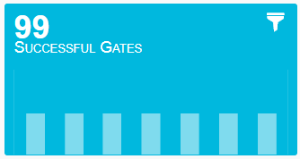
- Successful Gates:
snapshot documents
(document_history_type field) with
complete category on facet current.
- Critical Gates:
snapshot documents
(document_history_type field) with true category
on facet task_mgmt/critical_task.
|
| Sorting |
The results are sorted by time, the most recent on the right of the
chart. |
| Limits |
Only the last 12 weeks are displayed. |
| Colors |
By default, colors are predefined to Red, Orange, Blue, and Green for count of
[0; 0.5[, [0.5; 1[, [1; 1.5[, [1.5; 100000[. Colors can be configured in
Preferences. For more information, see Configuring Facet Displays. |
| Available Views |
Indicator values with history. |
| Interactions |
On this chart, you can click the filter icon to refine dashboard on (respectively):
- Gates held on time (start)
- Gates on time (end)
- Successful Gates
- Critical Gates
|
| Technical Details |
-
Consolidation
- These indicators rely on snapshots computed by
project_
getProjectHistoryFromEnovia aggregation
processor
- Data model
- Class: gate(or inherited)
- Property:
document_history_datetime
- Property:
document_history_type
- Property:
project_estimated_finish_date
- Property:
project_actual_finish_date
- Property:
project_estimated_start_date
- Property:
project_actual_start_date
- Mashup feed:
project_history
|