| Business Objects |
Projects and issues (data model classes "project_space" and
"issue") |
| Values (or X-Axis and Y-Axis) |
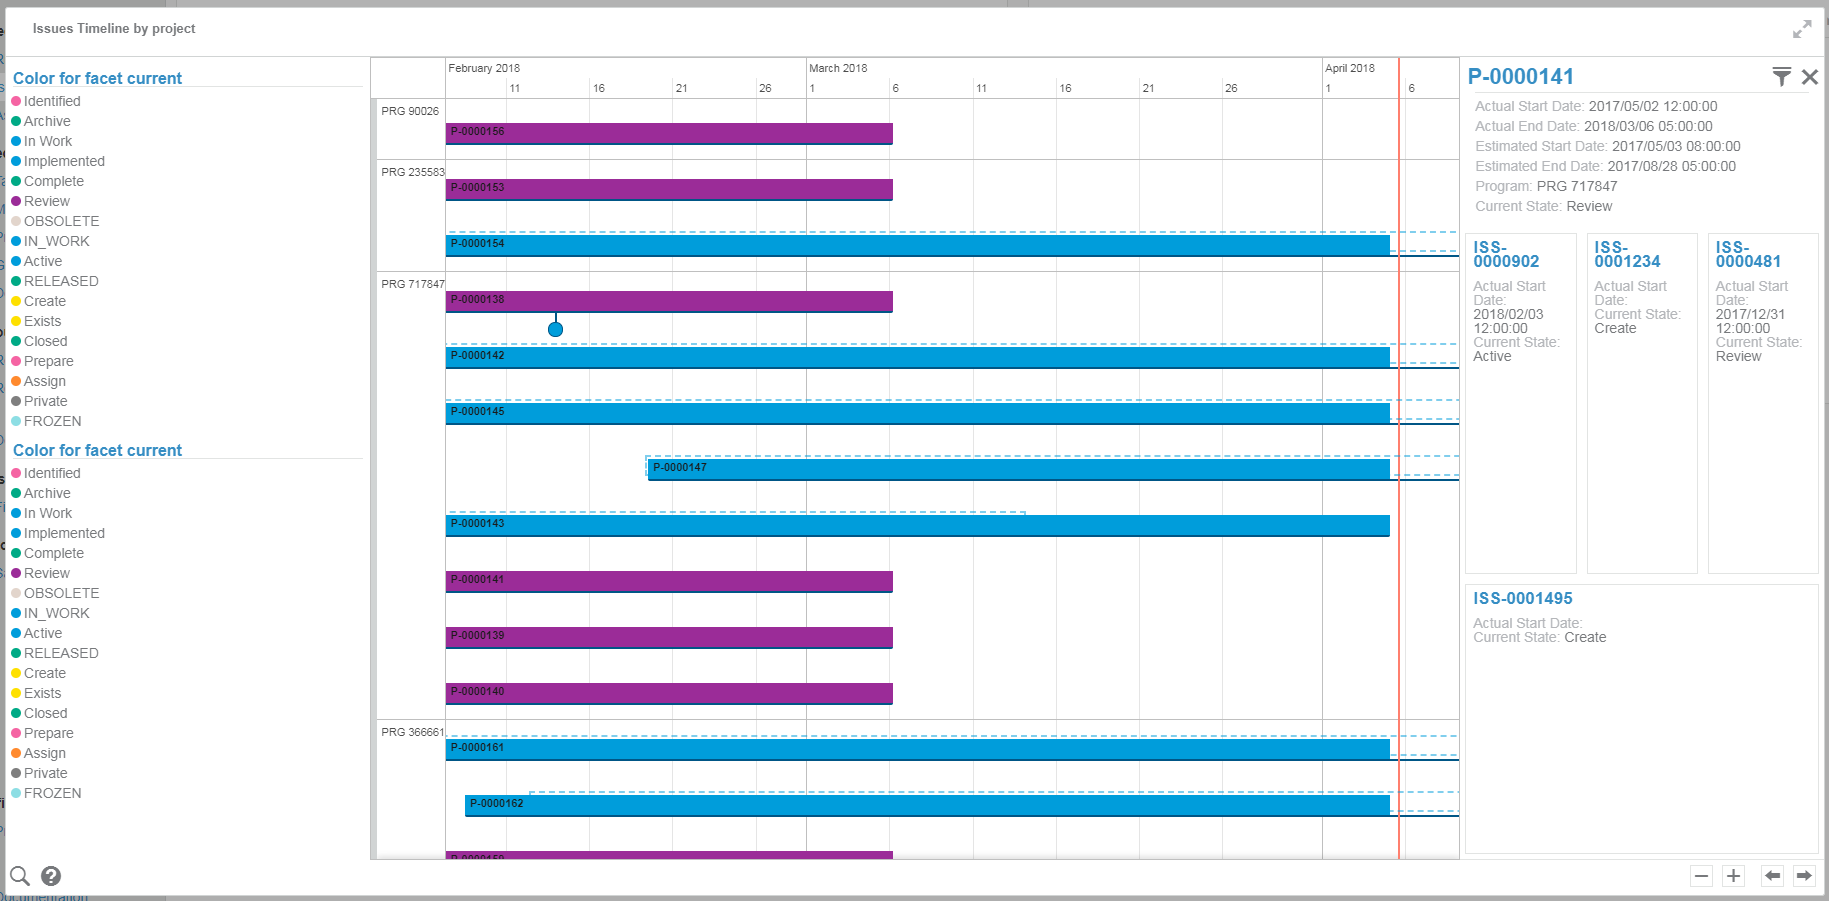
- X-axis: timeline
- Dashed blocks indicate the project estimated start and finish dates.
- Filled blocks indicate the project actual start and finish dates.
- Disks indicate issues estimated start dates.
- Y-Axis: Issue programs.
|
| Sorting |
The results are alphanumerically sorted, by project name. |
| Limits |
The timeline dynamically retrieves issues within the viewed time range. |
| Colors |
Colors are based on the current facet preferences and can be
configured in Preferences. For more information, see Configuring Facet Displays. |
| Available Views |
The timeline retrieves issues within the viewed time range dynamically. |
| Interactions |
On this chart, you can:
- Use
 to
search tasks by name (exact, full name) in current viewport to
search tasks by name (exact, full name) in current viewport
- Use
  to zoom
in and out of timeline. Alternatively, use Ctrl+Mouse wheel. to zoom
in and out of timeline. Alternatively, use Ctrl+Mouse wheel.
- Use
  to
scroll timeline horizontally. Alternatively, click and drag timeline to scroll
horizontally and vertically. to
scroll timeline horizontally. Alternatively, click and drag timeline to scroll
horizontally and vertically.
- Click an item (project or risk) to show information in the details panel
- Click
 to show or
hide legend to show or
hide legend
|
| Technical Details |
|