Open Issues | ||
| ||
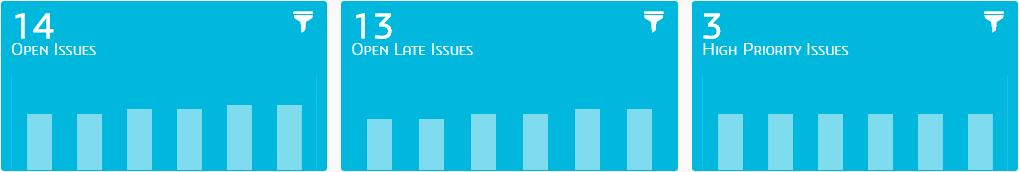
This chart displays a set of high-level indicators to summarize the status of Issues with history overview:
- Open issues: number of open issues (with statuses other than closed)
- Open late issues: number of issues with statuses other than closed, whose estimated end dates have passed
- High priority issues: number of issues with high priority
| Business Objects | Risk (data model class "risk") |
| Values (or X-Axis and Y-Axis) |
|
| Sorting | The results are chronologically sorted. |
| Limits | Only 12 weeks are displayed. |
| Colors | The color of this chart depends on the ratio between the current value and the
average of the 12 values:
|
| Available Views | Indicator values. |
| Interactions | On this chart, you can click the filter icon to refine the dashboard on:
|
| Technical Details |
|