| Business Objects |
Tasks (data model class "task") |
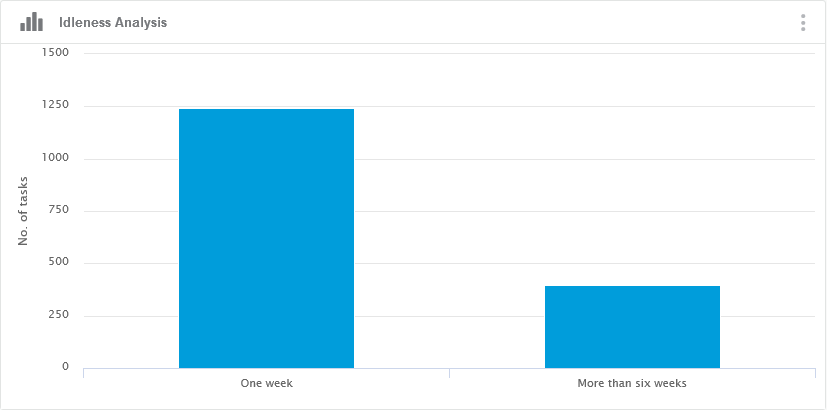
| Values (or X-Axis and Y-Axis) |
- X-Axis: idleness ranges (defined in the applicative configuration and user
preferences).
- Y-Axis: Number of open tasks.
|
| Sorting |
By default, the results are chronologically sorted. The results can be
configured in Preferences. For more information, see Configuring Facet Displays. |
| Limits |
There is no limit. |
| Colors |
The color of this chart is blue and is configured in
Preferences. For more information, see Configuring Facet Displays. |
| Available Views |
Bar chart, table. |
| Interactions |
On this chart, you can:
- Click the bars to filter on corresponding project.
- Click
 to
switch to fullscreen display. to
switch to fullscreen display.
- Click
 to switch
to table display. to switch
to table display.
|
| Technical Details |
Data model |