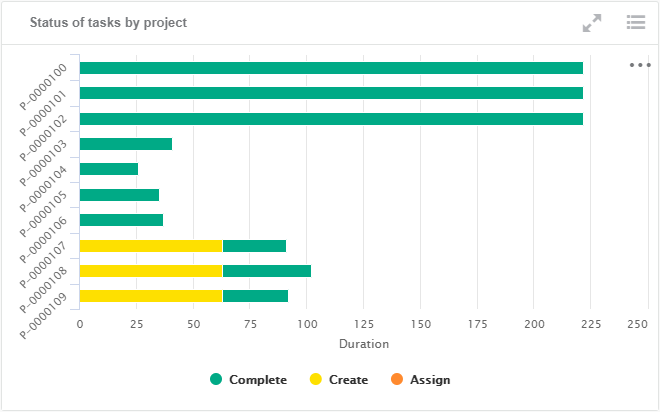
Status of Tasks by Project | ||
| ||
| Business Objects | Risk (data model class "risk") |
| Values (or X-Axis and Y-Axis) |
|
| Sorting | The results are alphabetically sorted, by name. |
| Limits | By default, only the top 10 categories are displayed. Note:
You can change the
pagination to display all the categories by clicking
 . . |
| Colors | Colors are configured in Preferences. For more information, see Configuring Facet Displays. |
| Available Views | Percentage bar chart. |
| Interactions | On this chart, you can:
|
| Technical Details |
|
 to
switch to fullscreen display.
to
switch to fullscreen display. to switch
to table display.
to switch
to table display.